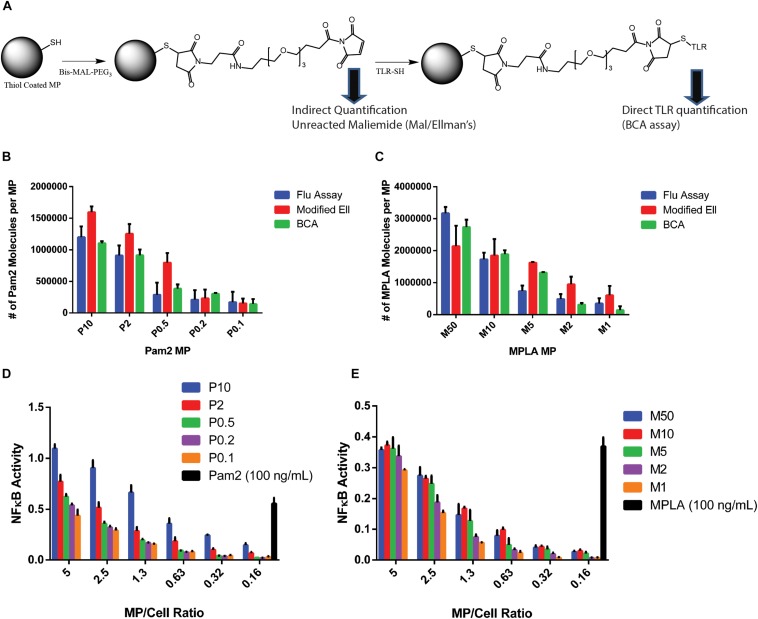
FIGURE 2.
TLR agonists surface conjugation and quantification. (A) Chemistry schematic for MP modification with TLR ligands. (B) After conjugating Pam2 to 2 μm diameter MPs and washing to remove unreacted TLR agonists, the total TLR agonist conjugated to MPs were tested with the three analytical quantification methods, Fluorescence, Ellmans or BCA. (C) The analysis from part B was repeated with MPLA conjugated MPs. (D) one million RAW Blue cells were incubated with varying numbers of Pam2 conjugated MPs formulations or free Pam2 (100 ng/mL) for 16 h, then tested using a Quanti-blue SEAP reporter assay for NFkB activity. Experiments were performed as technical triplicates. The red line indicates baseline activation. (E) Repeated analysis of part (D) with MPLA conjugated MPs and 100 ng/mL free MPLA. Error bars represent standard deviation of triplicate experiments. MP labeling scheme: P for Pam2 and M for MPLA, number represents concentration of agonist during reaction in μg/mL (e.g., P10- MPs conjugated with 10 μg/ml Pam2).

