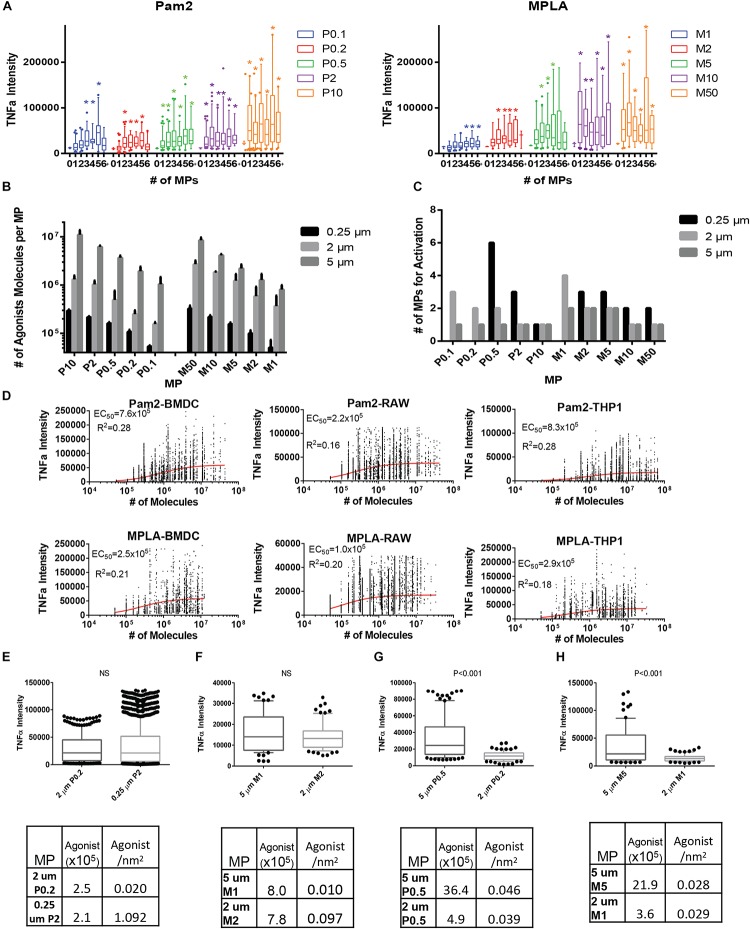
FIGURE 3.
TLR coated MPs induce innate immune cell TNFα expression, which correlates with total number of TLR agonists exposed to cells. (A) 10 million BMDCs were incubated with two million varying Pam2 or MPLA conjugated 2 μm MPs overnight in 1 μg/mL brefeldin (A) BMDCs were then washed, fixed, permabilized, stained and analyzed with imagestream (>100,000 cells per run, done in triplicate then combined). TNFα expression was then compared to the number of particles which cells uptake (1, 2, 3, 4, 5, or >5 which we call 6+) and compared to baseline TNFα (the average TNFα expression of unstimulated BMDCs). Conditions with a significant (p < 0.05) increase in TNFα when compared to unstimulated cells are marked with a colored star. Data for Pam2 is on right and MPLA is on the left. For each condition, box and whisker plots represent one standard deviation (box) and error bars for (A) and (B) represent 90/10% range with dots >90 or <10% range, with N > 10 and significance as p < 0.05. (B) After conjugating Pam2 or MPLA to 0.25 and 5 μm diameter MPs and washing to remove unreacted TLR agonists, the total TLR agonist conjugated to MPs were tested with the three analytical quantification methods, Fluorescence, Ellmans or BCA, then averaged. Error bars represent standard deviation from all three testing methods. (C) Bar graph representing number of MPs that BMDCs uptake for each MP formulation that had a significant average TNFα signal above the average unstimulated BMDC. (D) TNFα expression is well correlated with total number of TLR agonists on MP surfaces. By further analyzing the imagestream data, the TNFα expression for BMDCs that uptake any number of MPs was compared with the total number of TLR agonists that interact on a BMDC surface (calculated by multiplying the number of molecules per MP by the number of MPs that cells uptake). Included are curvefits for Pam2 (top) or MPLA (bottom) MPs with BMDCs (left), RAWs (middle) or THP-1 (right). EC50 and R2 values were determined using a Hill curve fit model in Graphpad 7 software. (E) We selected two MP formulated that either had similar total number of Pam2 agonists per MP (see table below) and compared the levels of TNFα secretion when BMDCs with a single MP. Statistical difference between the two group is shown above graph, if p > 0.05 then it is not significant (NS). (F) similar to part (E) but for MPLA MPs (G) Similar analysis as in part (E), but comparing two MP formulations with similar Pam2 agonist density. (H) Similar to (G) but with MPLA MPs.

