
Figure 1.
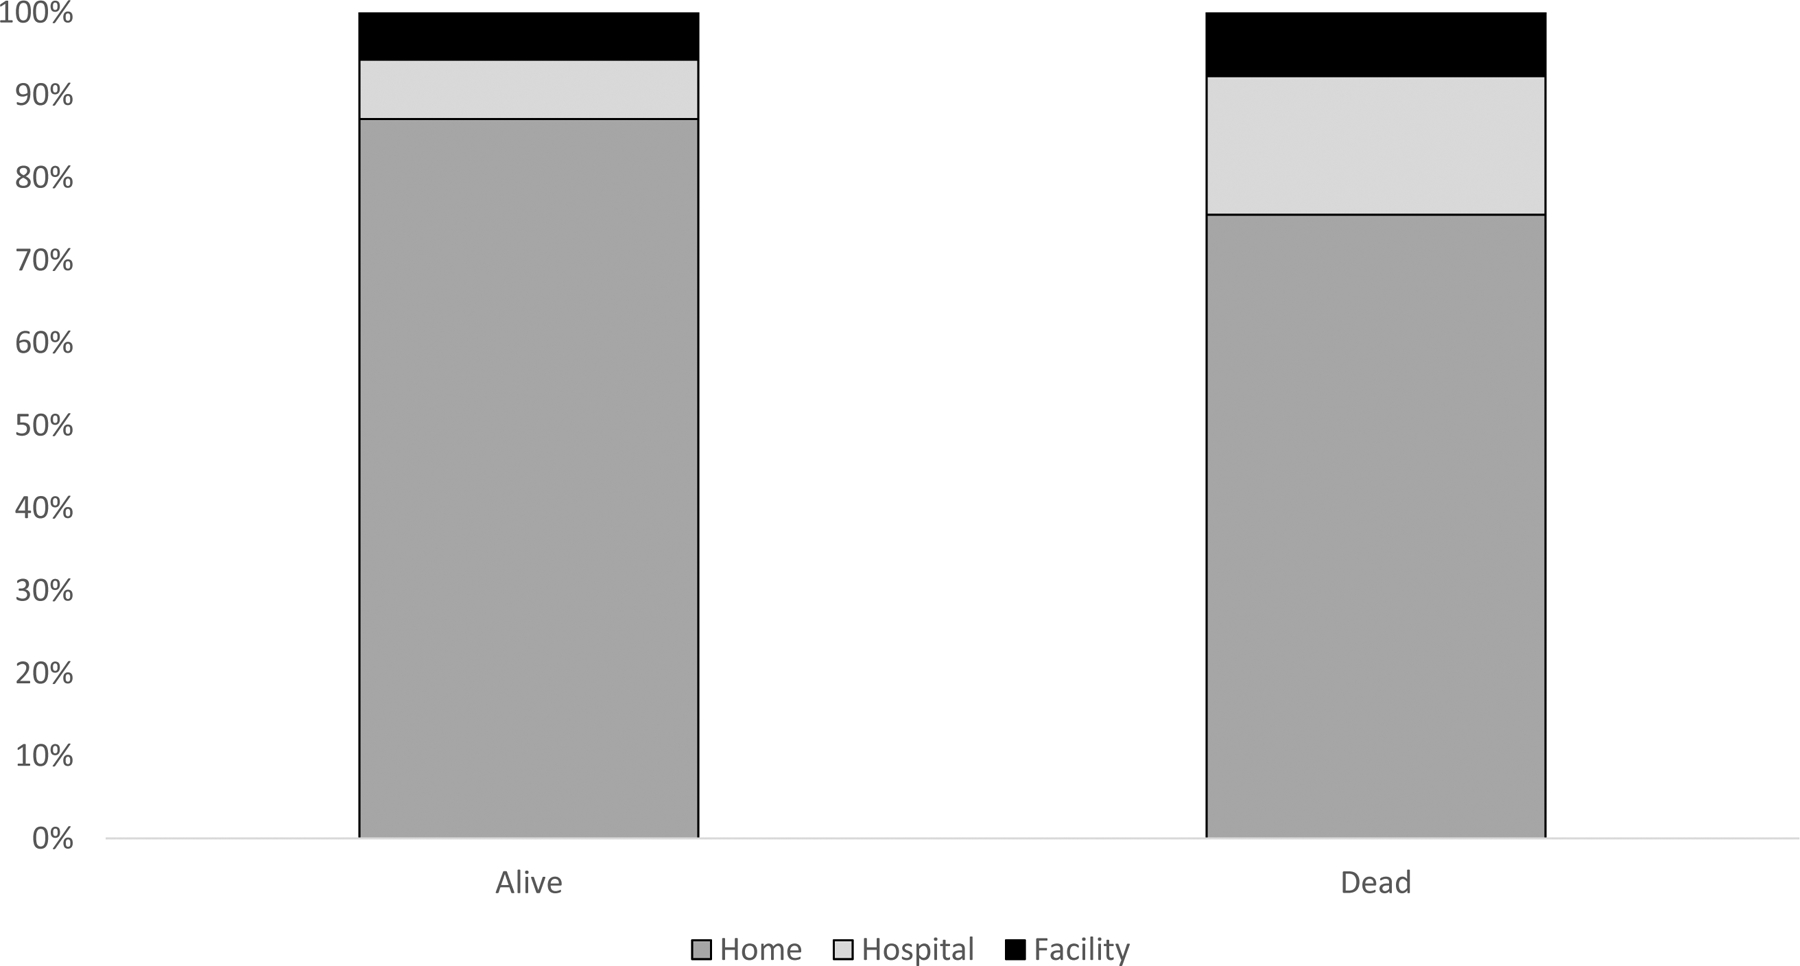
Percentage of time spent at home, in the hospital and in a facility during the year following major cancer surgery. Data are adjusted for procedure type, age, gender, race, Charlson Score, and calendar year.
Official websites use .gov
A
.gov website belongs to an official
government organization in the United States.
Secure .gov websites use HTTPS
A lock (
) or https:// means you've safely
connected to the .gov website. Share sensitive
information only on official, secure websites.
Percentage of time spent at home, in the hospital and in a facility during the year following major cancer surgery. Data are adjusted for procedure type, age, gender, race, Charlson Score, and calendar year.