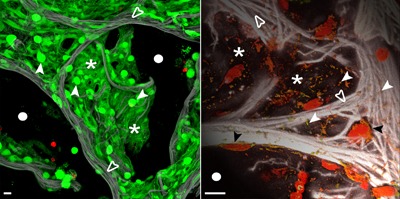
Figure 1.

High‐end spectral confocal microscopy of living human lung tissue to illustrate the complex cellular composition of the human alveolus and the methodological potential. The tissue in the left panel was loaded with live/dead stain (calcein, green/life; ethidium bromide, red/dead). Green stained cells constitute the intact alveolar wall, bright ones are AEC‐II (white arrow heads), whereas dim ones reflect flat AEC‐I (asterisk). A tight intertwined network of elastic fibers (collagen/elastin, gray) serves as scaffold for the AEC (which is highly auto‐fluorescent) and the hidden capillary system (open arrowheads). The dark black areas indicate the air space of the alveoli (white circles). The right panel shows that live tissue microscopy can reach a resolution at the organelle level. Mitochondria stained for their DNA (Syto82, red) and membrane potential (MitoTrackerOrange, green) are depicted in orange (white arrow heads) demonstrating their distribution in the alveolar septae (asterisk). The strong elastic scaffold (gray, open arrow heads) and nuclear DNA of AEC (Syto82, red) shape the alveolar wall, black areas show the transition into the air space (white circles). All images have been acquired using a LSM 780 spectral microscope (37 °C, 5% CO2), Objective LCI 40xW C‐Apochromat NA/1.2 (Carl Zeiss, Jena, Germany). Spectral confocal imaging and linear unmixing of fluorescence dyes and tissue auto‐fluorescence was performed for z‐stacks up to 50 μm tissue depth. Display adjustment for clear visualization of structures was performed. Left image is a maximum intensity projection and right panel a 3D surface rendering. Bar 10 μm.
