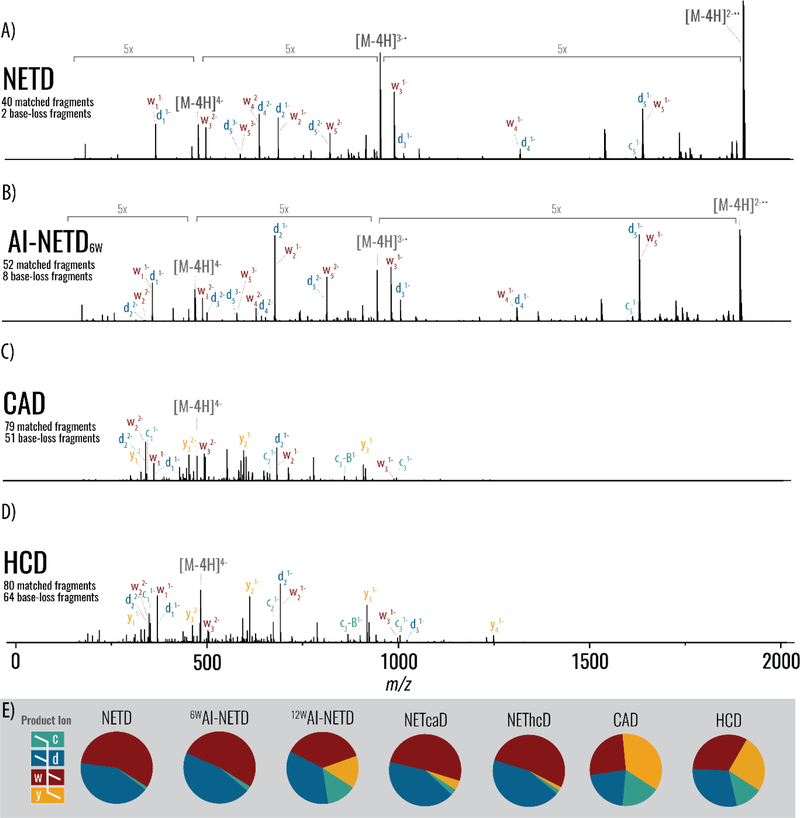
Figure 2. Tandem mass spectra and summary fragmentation profiles for a short, modified ribonucleic acid with various activation methods.
(A) MS/MS spectra of the 6-nucleotide modified RNA after 50ms of NETD, (B) 50ms of AI-NETD at 6 W, (C) CAD, and (D) HCD. Note each panel presents a spectrum that results from averaging 20 single-scan spectra and are shown on the same intensity scale. Charge-reduced intact species’ peaks are indicated by brackets in grey text. (E) Summary of product ion distributions, based on relative intensity, for the various activation methods.

