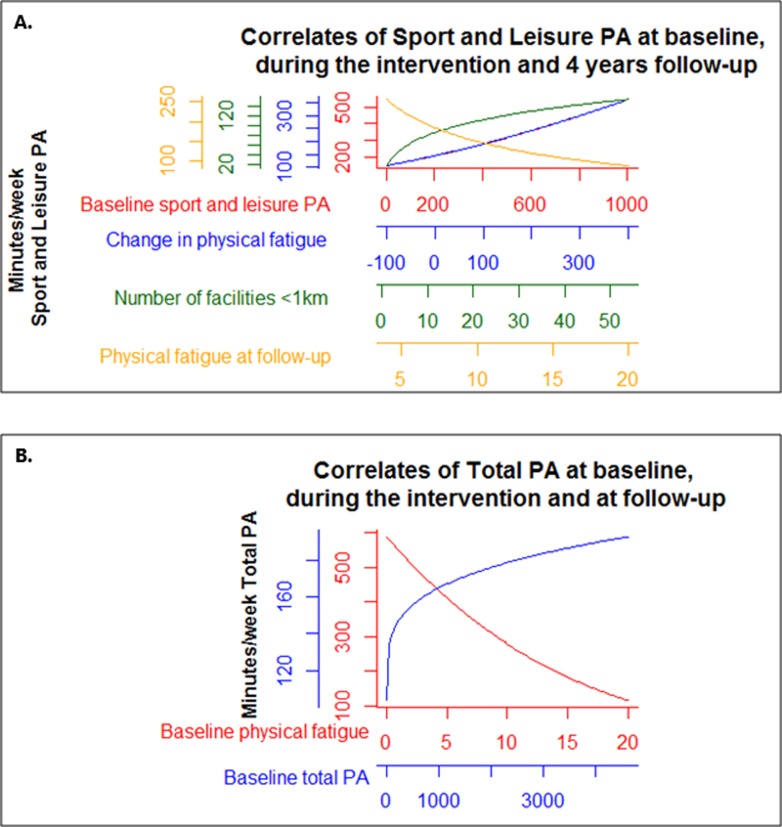
Fig 3. Correlates of both total and sport and leisure PA 4 years post-diagnosis.
Graphical representation of the association between correlates and (A.) moderate-to-vigorous sport and leisure and (B.) total physical activity levels (min/week) to simplify interpretation. All correlates have their own x- and y-axes. Note that the x-axes also contain extreme values.

