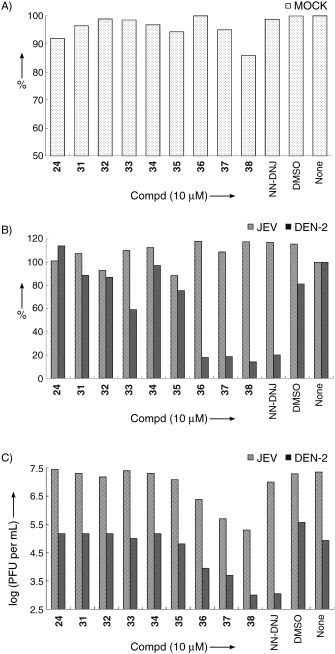
Figure 2.

Cell‐based assays of the anti‐JEV and anti‐DEN effects of compounds 24, 31–38 and NN‐DNJ (10 μm). A) Cell survival was measured by XTT assays. Data are shown as the percentage versus the mock‐infected BHK‐21 cells without inhibitor treatment (none, 100 %). B) The viral protein expressions of IFA were read by fluorescence microplate reader (Molecular Device) with an excitation wavelength of 355 nm and an emission wavelength of 488 nm. Data are shown as the percentage versus untreated inhibitor 1. C) The culture supernatants were collected for viral titration by plaque‐forming assay. The virus titers are shown as PFU (plaque forming unit) per milliliter. Representative results from two independent experiments are shown here.
