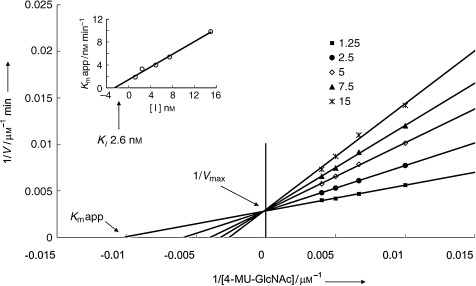
Figure 4.

Lineweaver–Burk double reciprocal plots of compound 54 were carried out to obtained K m app and V max values. Moreover, K i was obtained from a replot of the K m app and inhibitor concentrations. The K i value of each molecule is shown on the y axis.
