Figure 2.

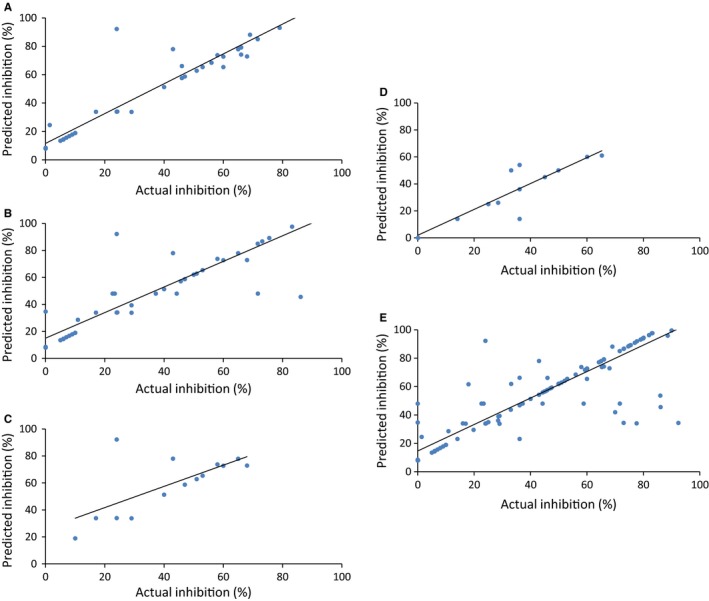
Scatter plot between actual and predicted percentage inhibition on independent validation datasets of (A) HIV, (B) HCV, (C) HBV, (D) HHV, and (E) general (26 viruses)

Scatter plot between actual and predicted percentage inhibition on independent validation datasets of (A) HIV, (B) HCV, (C) HBV, (D) HHV, and (E) general (26 viruses)