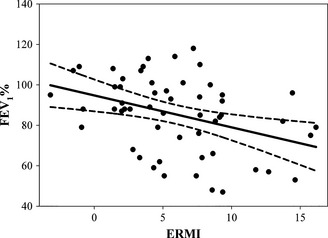
Figure 1.

Scatter plot of Environmental Relative Moldiness Index (ERMI) values (n = 55) and the regression line (solid black) through the corresponding forced expiratory volume in one‐second percent predicted (FEV 1%) values and the 95% confidence interval (dashed lines).
