Figure 2.
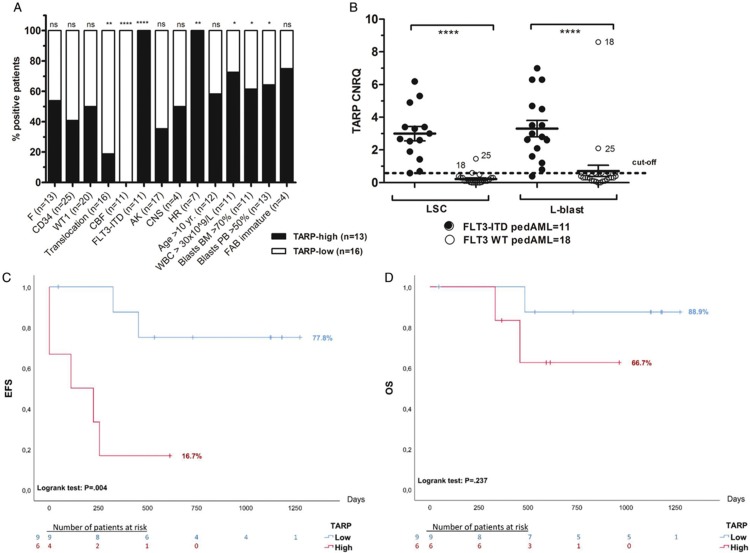
TARP transcript expression in pedAML in relation to subgroups and outcome. Correlation between patient characteristics and outcome between pedAML patients dichotomized as TARP-low (n = 16) and TARP-high (n = 13). TARP expression was measured by qPCR, and CNRQ values were interpreted against a cut-off calculated based on the expression in healthy controls (see Supplemental Materials). p values <.05 were considered as significant. One, two, three or four asterisks are indicative for the level of significance (p < .05, p < .01, p < .001 and p < .0001, respectively). (A) Bars display the percentage of patients (%), harboring the characteristic shown in the x-axis, for TARP-high (black) and TARP-low (white) pedAML. The total number of patients positive for each characteristic is shown between parentheses. (B) Differential TARP expression between FLT3-ITD mutated and FLT3 WT pedAML patients measured in the LSC and L-blast compartment. FLT3-ITD mutated pedAML showed a significantly higher TARP expression in both LSC (p < .0001) and L-blast (p < .0001). Thirteen out of the 29 pedAML patients were classified as TARP-high, that is, 11/11 FLT3-ITD pedAML and 2/18 FLT3 WT pedAML (encoded by “18” and “25”). Horizontal bars indicate means, error bars indicate ±SEM, horizontal square brackets represent statistical comparisons and the dotted line represent the cut-off for elevated TARP expression. (C-D) Kaplan–Meier EFS and OS survival plots based on 15 pedAML treated in the NOPHO-DBH AML2012 protocol, dichotomized as TARP-high (n = 6, 4/6 FLT3 ITD and 2/6 FLT3 WT) or TARP-low (n = 9, 9/9 FLT3 WT). The number of days is shown on the x-axis, and the percentage as a ratio (100% equals 1.0) on the y-axis. Drop-outs of the patients are indicated at the bottom per block of 250 days. (C) EFS was significantly lower in TARP-high versus TARP-low patients (16.7% vs 77.8%, respectively, p < .01). (D) OS was lower in TARP-high vs TARP-low patients (66.7% versus 88.9%, respectively), though at a non-significant level (p > .05). AK = abnormal karyotype, BM = bone marrow, CEBPA = CCAAT/enhancer-binding protein alpha, CNRQ = calibrated normalized relative quantity, CNS = central nerve system, F = female, FAB = French-British-American, FLT3 = fms-like tyrosine kinase receptor-3, HR = high risk, ITD = internal tandem duplication, LSC = leukemic stem cell, L-blast = leukemic blast, M = male, MT = mutated, NK = normal karyotype, NPM1 = nucleophosmin, PB = peripheral blood, PedAML = pediatric acute myeloid leukemia, qPCR = quantitative polymerase chain reaction, SEM = standard error of the mean, SR = standard risk, TARP = T-cell receptor γ chain alternate reading frame protein, WT1 = Wilms’ tumor 1, WBC = white blood cell, WT = wild type, yr = years.

