
Figure 1.
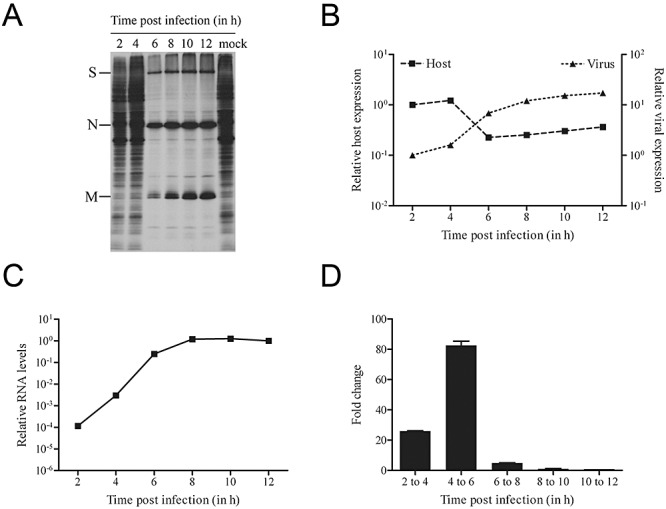
Kinetics of the MHV‐induced host translational shutoff. A. LR7 cells were infected with MHV (moi 10) and metabolically labelled for 15 min starting at the indicating time points. Cell lysates were processed and subjected to SDS‐PAGE as described in Experimental procedures. Positions of the viral proteins S, N and M are indicated. B. The amount of radioactivity in the gel was quantified with a PhosphorImager. For each time point, the amount of radioactivity in the MHV structural proteins S, N and M was combined (viral expression). For the host proteins, the amount of radioactivity in the regions between the MHV proteins was quantified (host expression). The data are presented as relative expression (2 h post infection = 1). C and D. Genomic viral RNA levels in MHV‐infected LR7 cells (moi 10) were measured by quantitative RT‐PCR at the indicated time points post infection. The data are presented as relative viral RNA levels (12 h post infection = 1) in C, or as the fold change increase relative to the previous time point in D. Error bars indicate the standard deviations (n = 3).