
Figure 1.
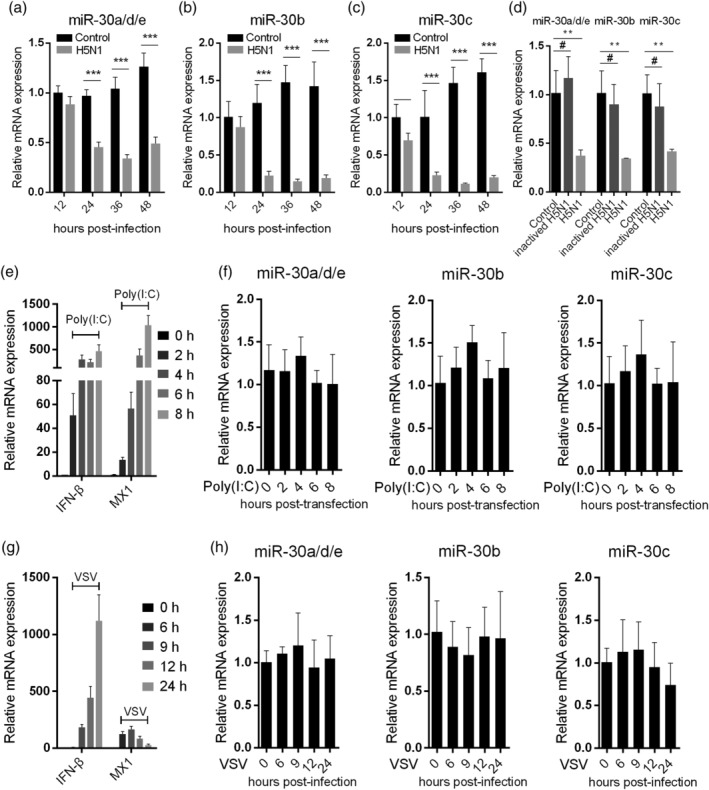
Influenza virus infection downregulates miR‐30 expression. A549 cells were infected with 0.1 MOI of H5N1 influenza virus, and the expression levels of miR‐30a/d/e (a), miR‐30b (b), and miR‐30c (c) were detected at 12, 24, 36, and 48 hpi by qRT‐PCR. (d) A549 cells were infected with heat‐inactivated H5N1, and after 36 hr, miR‐30 expression was detected by qRT‐PCR. A549 cells were transfected with 200 ng poly(I:C), IFN‐β and MX1 (e), and miR‐30 (f) were tested at the indicated time points post‐transfection by qRT‐PCR. A549 cells were infected by VSV with an MOI of 0.1, IFN‐β and MX1 (g), and miR‐30 (h) were detected at the indicated time points post‐infection by qRT‐PCR. The values are shown as the mean and SD and are representative of three independent experiments. The data in (a–c) were analysed using two‐way ANOVA; data in (d) were analysed using Student's t test. The values are shown as the mean and SD and are representative of three independent experiments. #: non‐significant, ***p < .001; **p < .01; *p < .05