
Figure 6.
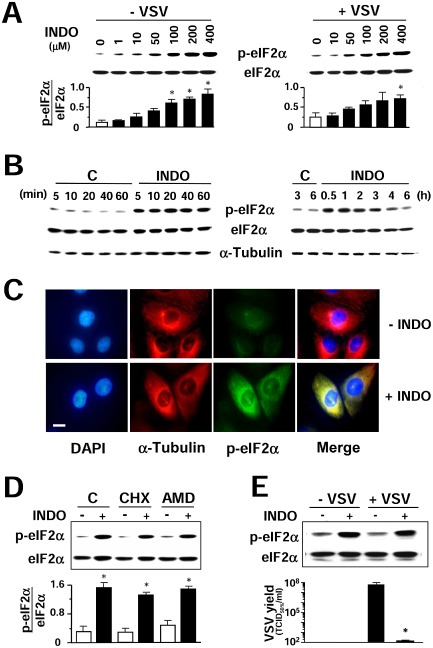
Indomethacin induces eIF2α phosphorylation.
A. Immunoblot using antiphosphoSer‐51‐eIF2α (p‐eIF2α) or eIF2α panspecific antibodies performed on lysates from mock‐infected (−VSV) or VSV‐infected (+VSV) cells treated with different concentrations of INDO (30 min) (upper panel). Graph shows the p‐eIF2α/eIF2α ratio for each sample (lower panel). Values represent the mean ± SD from three experiments. *P < 0.05 versus untreated control.
B. Kinetics of eIF2α phosphorylation following 400 μM INDO treatment was determined as described in A. α‐Tubulin levels are shown as loading control.
C. Immunofluorescence analysis of MA104 cells treated with 400 μM INDO (+INDO) or control diluent (−INDO) for 45 min, and labelled with antiphosphoSer‐51‐eIF2α (p‐eIF2α) (green) and anti‐α‐tubulin (red) antibodies. Nuclei are stained with DAPI (blue). Bar = 15 μm. The overlay of the three fluorochromes is shown (merge). Microscopy was performed on a Leica DM‐IL microscope equipped with UV excitation filters, and the images were captured with a Leica DC‐300 camera using Leica Image‐Manager software.
D. MA104 cells were pretreated for 30 min with control vehicle (C), 50 μg ml−1 cycloheximide (CHX), which inhibited [35S]‐methionine incorporation into proteins by more than 98%, or 5 μg ml−1 AMD, which inhibited [3 H]‐uridine incorporation into acid‐insoluble material by more than 80%, and then treated with INDO (+) or vehicle (−) for 30 min. Lysates were analysed by Western blot using antiphosphoSer‐51‐eIF2α (p‐eIF2α) or eIF2α panspecific antibodies (top panel). Graph shows the p‐eIF2α/eIF2α ratio for each sample (bottom panel). Values represent the mean ± SD from two experiments. *P < 0.05 versus untreated control.
E. Mock‐infected or VSV‐infected BHK‐21 cells were treated with 400 μM INDO after the adsorption period and, at 2 h p.i., were analysed by Western blot as in D (top panel). In parallel, virus yields were determined by TCID 50 infectivity assay at 8 h p.i. (bottom panel). Data represent the mean ± SD of duplicate samples from a representative experiment of two with similar results. *P < 0.05.