
Figure 3.
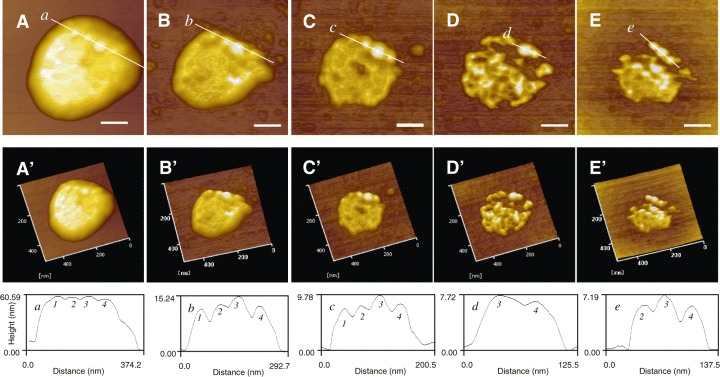
Topographic AFM images of different single SARS‐CoV virions before (the first column) and after (the second to fifth column) treatment with hydroxyoctanoic acid. Images acquired by zooming into the boxed areas in Fig. 2A are displayed in the B–E (two‐dimensional) and B′–E′ (three‐dimensional). Scale bar = 100 nm for each image in the first row. The corresponding cursor profiles (the third row) provide quantitative measurements of the dimensions for spike proteins.