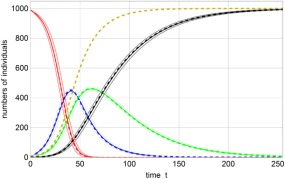
Figure 2.

Solution curves of the SEIR model (3). Shown are the numbers of susceptible individuals S(t) (red), exposed individuals E(t) (blue), infectious individuals I(t) (green), and recovered or dead individuals R(t) (black). Expectation values <X(t)> (X ≡ S, E, I, R) are given in full color embedded in one‐standard deviation error bands, <X(t)> ± σ(X(t)), with the limits in light color. The dashed lines refer to the solutions of the ordinary differential equation (ODE) (4), x(t) with x ≡ s, e, i, r, and the yellow dashed curve represents d(t) = i(t) + r(t). The disease in this case affects the entire population. Parameters: N = 1000, β = 0.5, k = 0.05, γ = 0.025, which correspond to a high basic reproductive number of R 0 = 20. Initial conditions: S(0) = 990, I(0) = 10.
