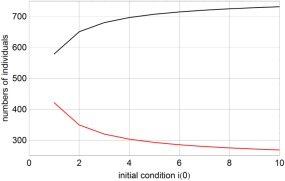
Figure 3.

Dependence of the outcome of an epidemic on the number of initially infected individuals. The two curves represent the final number of susceptible and recovered individuals, (red) and (black) for different numbers of initially present infectious individuals i(0). The parameters were taken from the 1995 Ebola outbreak in Congo 14: β 0 = 0.33, β 1 = 0.09, τ = 100, t h = 0.71, k = 0.189, and γ = 0.178 with time measured in days. A small population size, N = 1000, was chosen for the purpose of illustration. The critical value of the stationary number of susceptible is .
