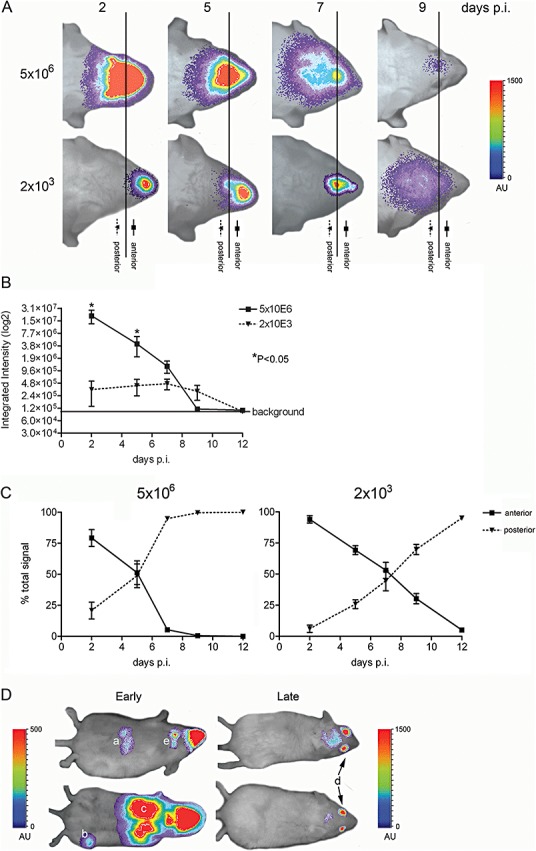
Figure 4.

The inoculation dose affects virus dissemination. BALB/c mice were inoculated intranasally with 5 × 10⁶ or 2 × 10³ TCID50 of MHV‐EFLM. At the indicated times post inoculation (days p.i.), mice were processed for BLI. A. Dorsal images of a representative mouse are portrayed. The emitted photons were measured at the indicated time points and are displayed as a heat map in an overlay representation. Scaling [in arbitrary units (AU)] is similar in all depicted images. The vertical line in all panels represents the arbitrary border between the anterior (nose) and posterior (brain) regions of the head, which were selected for photon quantification. B. The total amounts of emitted photons from the complete head regions at the different time points were quantified and are expressed as integrated intensities on a log2 scale with standard deviations (n = 4). C. The relative amounts of emitted photons from the anterior and posterior regions of the head (i.e. brain versus nasal epithelium) at the different time points were quantified and are expressed as percentage of the total signal, with standard deviations for both virus doses (n = 4). D. Interesting phenotypes of mice at early (i.e. 2 days; ventral images portrayed) or late (i.e. 9 days; dorsal images portrayed) times post inoculation with 5 × 10⁶ TCID50 of MHV‐EFLM are shown: (a) liver, (b) paw, (c) lung, (d) eye and (e) cervical lymph nodes. Note that the scaling [in arbitrary units (AU)] differs between the ventral and dorsal images.
