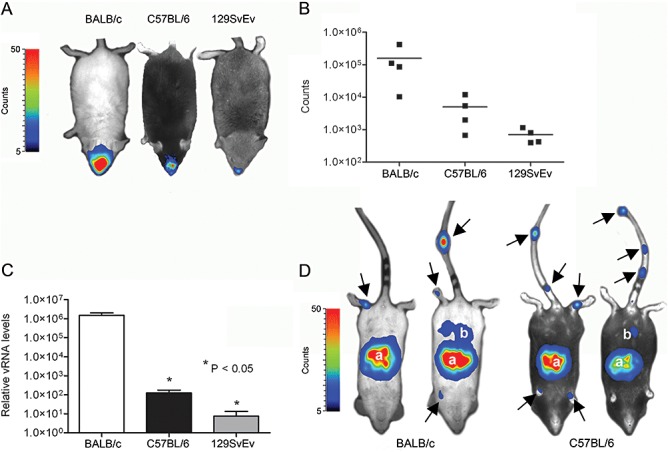
Figure 6.

Replication of MHV‐EFLM in mice of different genetic background. The 6‐ to 8‐week‐old female BALB/c, C57BL/6 and 129SvEv mice were inoculated intranasally with 106 TCID50 of MHV‐EFLM. A. BLI was performed at 5 days post inoculation as described in the Experimental procedures. Here, the Biospace photon imager was used as detector for reporter gene expression. The emitted photon counts were measured and are displayed as a heat map in an overlay image. A representative dorsal image is shown for the different mouse strains. B. The emitted photons from the head regions of each individual mouse were quantified and are expressed as the total number of counts measured within the 10 min imaging period. Data are corrected for the background values (signal from uninfected mice). C. Mice infected with wild‐type MHV‐A59 were sacrificed at day 5 post infection, after which the individual brains were collected. Total RNA was isolated and Taqman RT‐PCR was performed targeting MHV genomic RNA sequences. The relative viral RNA (vRNA) levels and standard deviations are depicted (n = 4). D. The 4‐week‐old BALB/c and C57BL/6 mice were inoculated intraperitoneally with 106 TCID50 of MHV‐EFLM. BLI was performed at 2 days post inoculation. Also here, the Biospace photon imager was used. The emitted photons were measured and are displayed as a heat map in an overlay image. Two representative ventral images are shown for the two different mouse strains. The anatomic locations displaying virus replication are indicated and include: (a) liver and (b) intestine. The arrows point to sites of virus replication in the tail and paws of the mice.
