Figure 1.

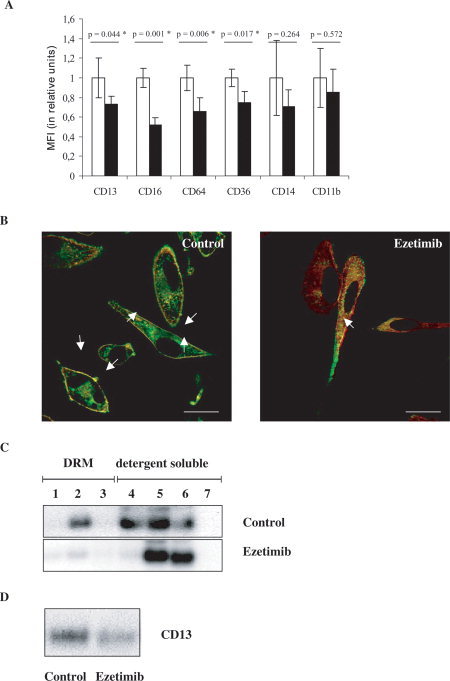
(A) Surface expression of raft‐associated antigens on monocyte‐derived macrophages in response to 10 μM Ezetimib. Relative mean fluorescence intensities (MFI) of control cells (treated with DMSO as solvent of Ezetimib, open bars) and Ezetimib‐treated cells (solid bars) were compared for each antigen (CD13, CD16, CD64, CD36, CD14, and CD11b, as indicated). MFI of control cells was taken as 1 unit, and the effect of Ezetimib was expressed as compared to control. Data are presented as mean ± S.D., P < 0.05 was considered as statistically significant (*) by using a paired t‐test for n = 3 repeats. (B) Cellular redistribution of CD13 (FITC, green) and annexin II (Texas Red, red) in control (left) and Ezetimib‐treated (right) human monocyte‐derived macrophages. Merged, representative confocal images are presented, showing an extensive shift of both proteins, from the plasma membrane to cytoplasmic vesicles, in response to 10 μM Ezetimib. Quantification of co‐localization (yellow) in the plasma membrane (arrows) was 96% in control (treated with DMSO as solvent of Ezetimib) and 11% in Ezetimib‐treated cells, respectively. Scale bars: 10 μm. (C) Shift of CD13 from detergent resistant (i.e. raft) to detergent soluble (i.e. non‐raft) fractions in response to Ezetimib. Sucrose density gradient fractions of Lubrol WX‐lysates were analyzed by immunoblot. Equal amounts of proteins were loaded on each lane. 1–3: detergent resistant membrane (DRM, i.e. raft) fractions, 4–7: detergent soluble (i.e. non‐raft) cellular fractions. In control cell (treated with DMSO as solvent of Ezetimib) lysates CD13 is clearly detectable in DRM and detergent soluble fractions. By contrast, in Ezetimib‐treated cell lysates CD13 is present only in detergent soluble fractions. (D) Decrease of the total cellular content of CD13 in monocyte‐derived macrophages in response to ezetimib. Immunoblot of whole cell lysates from control (left) and Ezetimib‐treated (right) cells. Equal amounts of protein were loaded on both lanes.
