Figure 1.

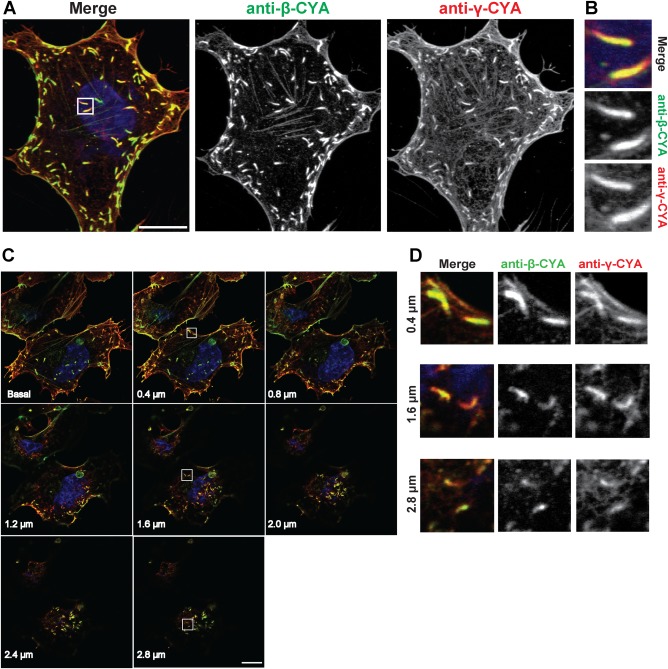
VACV comets contain both β‐ and γ‐CYA. (a) Fluorescent micrographs of hCMEC/D3 cells infected with VACV‐WR and fixed 8 hpi. Cells were stained with anti‐β‐CYA (green), anti‐γ‐CYA (red), and DAPI (blue). Scale bar is 10 μm. (b) Close‐ups of outlined sections in A. (c) Individual z‐stack planes of a single field of view for VACV‐infected cells, along with close‐ups of actin tails from three z‐planes (d). [Color figure can be viewed at http://wileyonlinelibrary.com]
