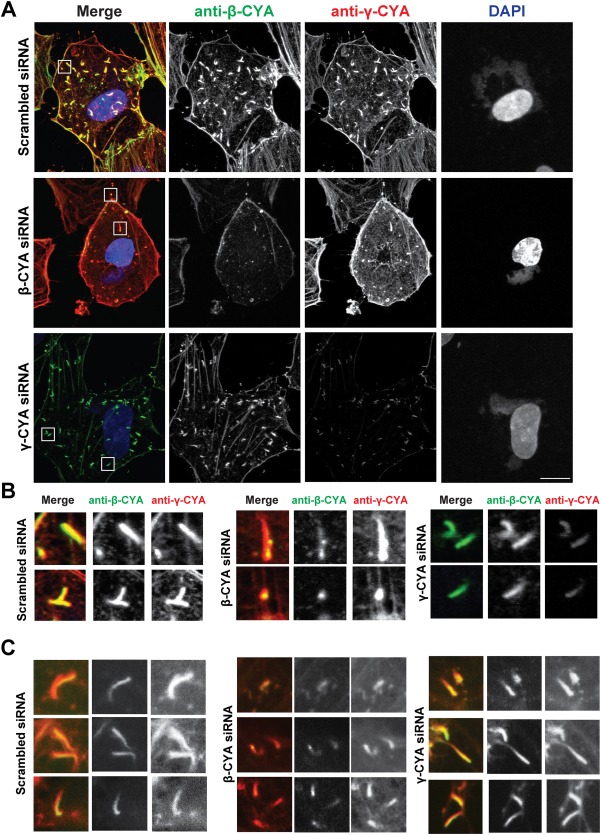
Figure 3.

Distribution of β‐ and γ‐CYA in VACV comets under CYA knockdown. (a) Fluorescent micrographs of hCMEC/D3 cells treated with the isoform‐specific siRNA described, infected with VACV‐WR and fixed at 8 hpi. Cells were stained with anti‐β‐CYA (green), anti‐γ‐CYA (red), and DAPI (blue). (b) Close‐ups of outlined sections in A. (c) Additional close‐up micrographs from other infected cells. Scale bar is 10 μm. [Color figure can be viewed at http://wileyonlinelibrary.com]
