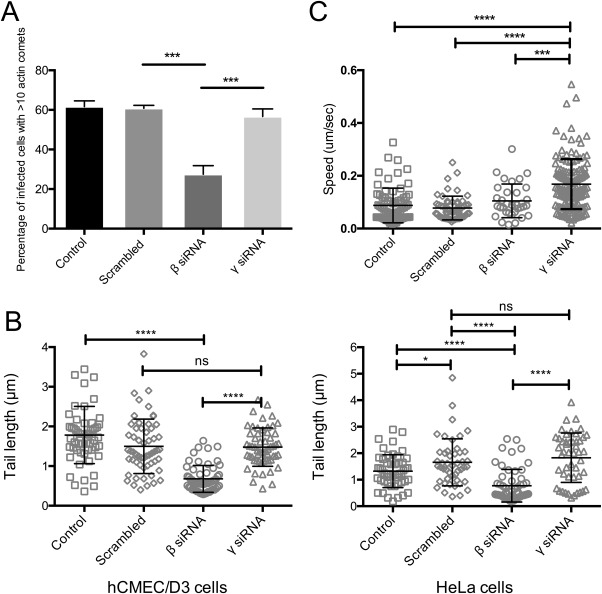
Figure 4.

Effects of CYA knockdown on VACV comet phenotype. (a) hCMEC/D3 cells were treated with the respective siRNA for 72 hr, followed by VACV‐WR infection at an MOI > 5. Cells were fixed 8 hpi and stained for F‐actin and the number of actin tails per cell was enumerated (‘***’: p < .001; n = 40 cells for each treatment, with 3 replicate experiments performed). (b) hCMEC/D3 (D1) and HeLa (D2) cell lines were treated with the siRNA as indicated for 72 hr and infected with VACV‐WR at an MOI > 3. Cells were fixed 8 hpi, followed by staining for F‐actin and viral envelope proteins. Actin tail lengths were measured using ImageJ image‐analysing software and graphs created using GraphPad PRISM, with nonparametric t‐tests used to determine significance in differences between parameters (n = 60 tails each). (c) Speeds of VACV actin comets were calculated using FIJI (ver. 2.0.0) image‐analyzing software from live‐cell imaging experiments and statistical analyses were carried out using GraphPad PRISM (ver. 6 for Mac OSX), with one‐way ANOVA and Tukey's multiple comparison tests. “ns”: p > .05, “*”: p ≤ .05, “***”: p ≤ .001, “****”: p ≤ .0001.
