
Figure 13.
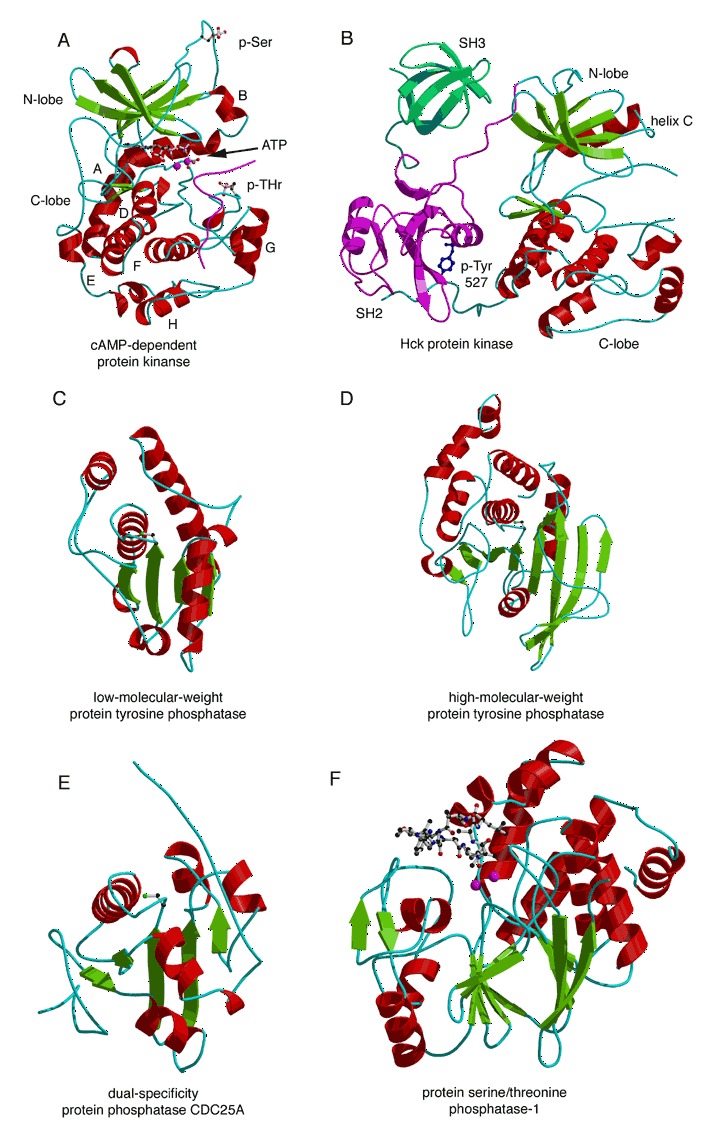
Protein kinase and phosphatase structures. (A) The structure of phosphorylated cyclic AMP‐dependent protein kinase complexed with ATP, Mn, and inhibitor (PDB entry 1atp). The peptide inhibitor is represented by a magenta worm. The ATP, Mn, and phosphorylated serine and threonine are shown as ball‐and‐stick models. (B) The structure of the inactive form of hematopoietic cell kinase of the Src family of protein kinases (PDB entry 1ad5). The SH3 and SH2 domains are colored blue‐green and magenta, respectively, and the catalytic domain is colored green and red. The phosphorylated tyrosine 572 is represented by a blue ball‐and‐stick model. The following protein phosphatases are all shown in approximately the same orientation with the catalytic cysteine displayed as a ball‐and‐stick model. (C) Low‐molecular‐weight protein tyrosine phosphatase (PDB entry 1phr). (D) High‐molecular‐weight protein tyrosine phosphatase‐1B (PDB entry 2hnq). (E) Dual‐specificity protein phosphatase CDC25A (PDB entry 1c25). (F) Protein serine/threonine phosphatase‐1 of the PPP family (PDB entry 1fjm).