
Figure 27.
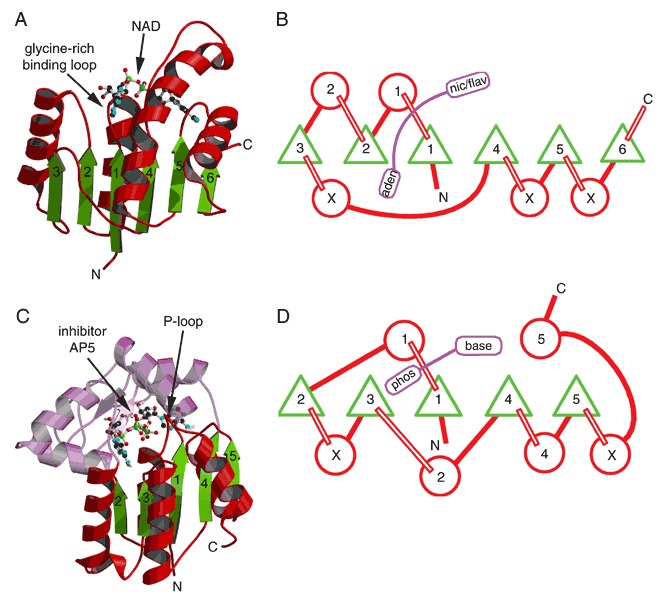
The classical dinucleotide‐ and mononucleotide‐binding folds shown by ribbon drawings and topology diagrams. In the topology diagrams, the β‐sheets are viewed from the C‐terminal edge with β‐strands represented by green triangles and α‐helices by red circles. Numbers indicate strand and helix order within the structure. Circles containing an “X” represent possible domain insertions. Bound nucleotides are colored purple. (A) Ribbon drawing of the NAD‐binding domain of dogfish lactate dehydrogenase with bound NAD represented as a ball‐and‐stick model (PDB entry 1ldm). (B) Topology diagram for the common core of the classical dinucleotide‐binding fold. (C) Ribbon drawing of adenylate kinase as an example of a mononucleotide‐binding protein (PDB entry 1aky). The portion of the structure that is not part of the nucleotide‐binding fold is colored purple. The bound inhibitor bis(adenosine)‐5′‐pentaphosphate (AP5) is shown using a ball‐and‐stick model. (D) Topology diagram for the common core of the classical mononucleotide‐binding fold.