
Figure 30.
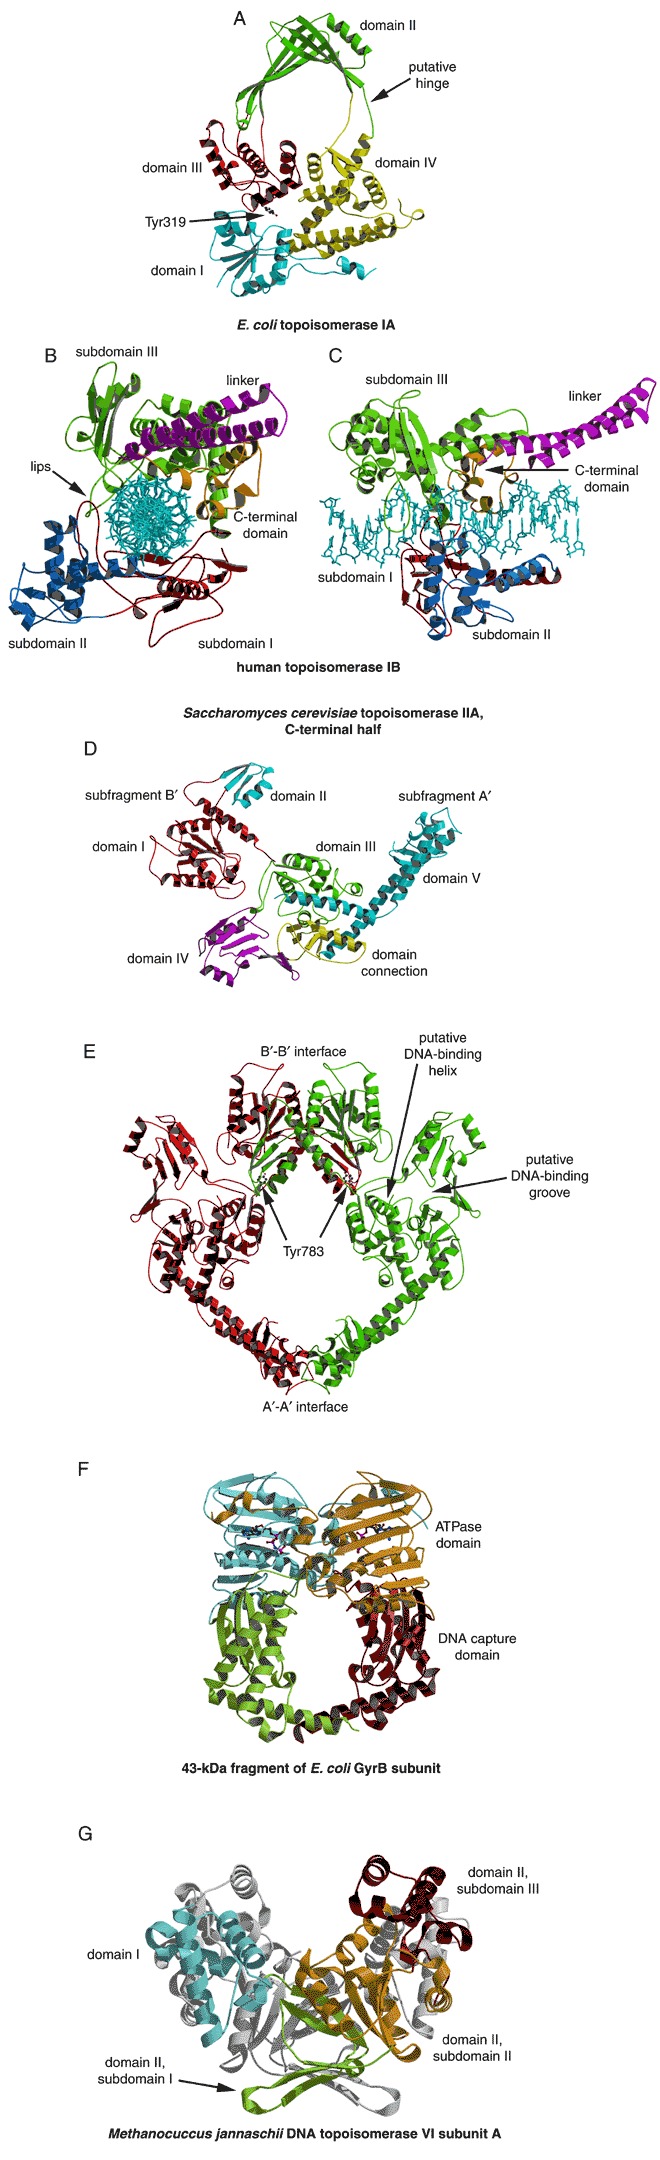
Topoisomerase structures. (A) Structure of the N‐terminal 67 kDa fragment of E. coli topoisomerase I (PDB entry 1ecl). The four domains are labeled and the side chain of the active‐site Tyr319 is represented by a ball‐and‐stick model. (B) Complex of human topoisomerase IB with 22‐bp DNA duplex (PDB entry 1a36). Each domain is color coded and labeled. DNA is a light‐blue ball‐and‐stick model. (C) Same as (B), but rotated 90° around the vertical axis. (D) Structure of the 92‐kDa fragment of yeast topoisomerase IIA showing the organization of domains. (PDB entry 1bgw). (E) Homodimeric form of the 92‐kDa fragment of yeast topoisomerase IIA. For clarity, the two monomers are colored red and green, respectively. (F) Homodimer of the 43‐kDa fragment of E. coli GyrB (PDB entry 1ei1). One monomer is blue‐green, the other is red‐orange. ADPNP bound to each monomer is represented by a ball‐and‐stick model. (G) Homodimer of Methanococcus jannaschii topoisomerase VI subunit A (PDB entry 1d3y). One monomer is colored according to domain and subdomain, the other is gray (program color “white”).