
Figure 34.
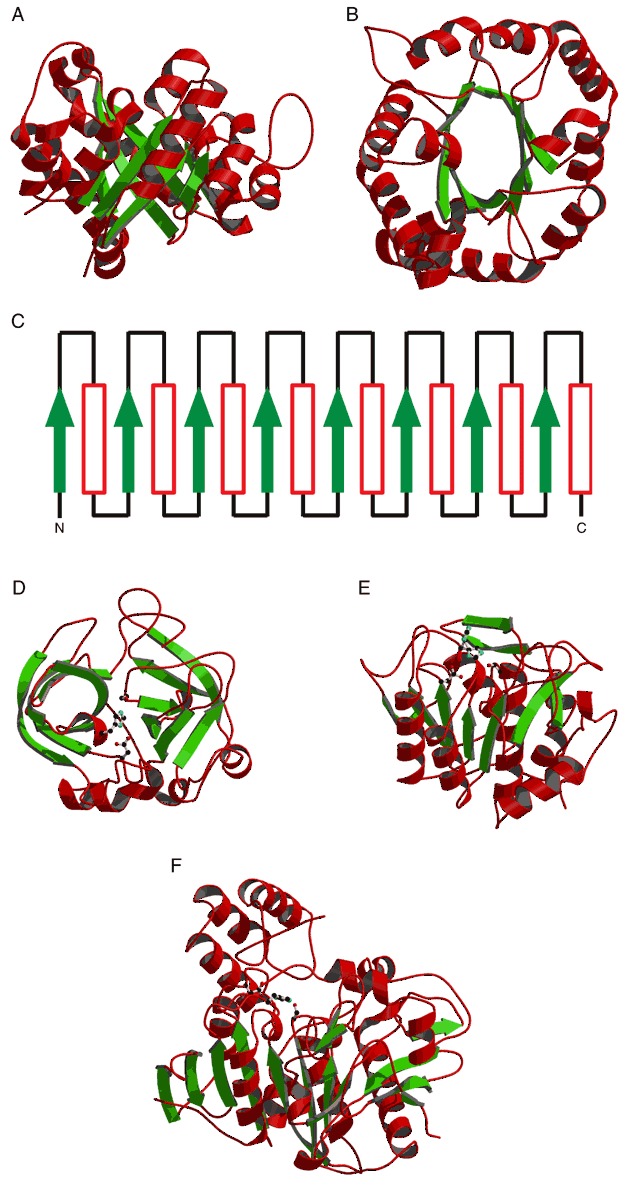
The TIM‐barrel (A to C) and serine protease fold (D to F). The side chains of residues in the active site catalytic triad are shown as ball‐and‐stick models in panels (D) and (F). (A) Side view of a ribbon drawing of triose phosphate isomerase as an example of a TIM‐barrel. (B) Ribbon drawing of triose phosphate isomerase viewed from the top. (C) Secondary structure schematic of the classical TIM‐barrel fold. β‐strands are represented by green arrows and α‐helices by red rectangles. (D) Structure of the trypsin‐like serine protease, collagenase (PDB entry 1hyl). (E) Structure of the subtilisn serine protease, subtilisn BPN′ (PDB entry 1sup). (F) The structure of the serine carboxypeptidase, wheat serine carboxypeptidase II (PDB entry 1wht).