
Figure 40.
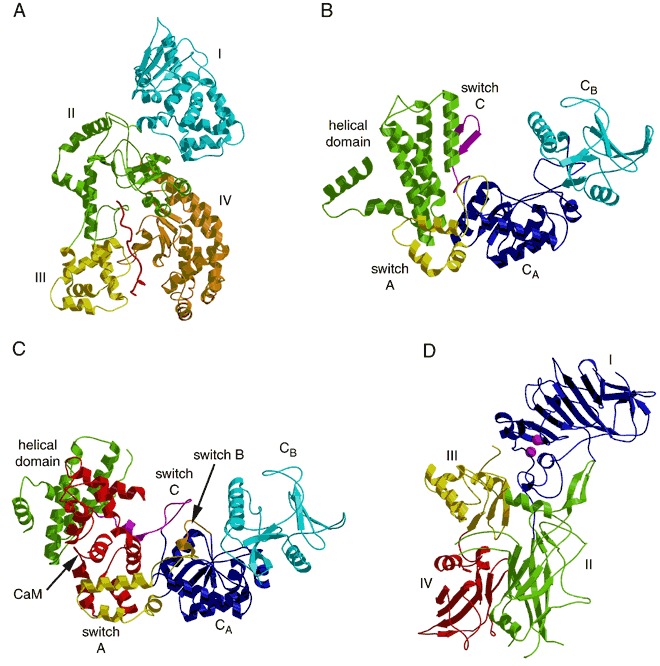
Structure of anthrax toxin. (A) Domains I through IV of the lethal factor (LF) are colored in blue, green, yellow, and orange, respectively (PDB entry 1jky). The bound MAPKK peptide is shown in red. This PDB entry does not include coordinates for the Zn atom. (B) The structure ofedema factor (EF; PDB entry 1k8t). The catalytic domains CA and CB are shown in blue and cyan, respectively. The helical domain and the switch A and C regions are shown in green, yellow, and magenta, respectively. The location of switch B is shown in the next panel. (C) CaM complexededema factor (PDB entry 1k90). The coloring scheme is the same as (B) with CaM in red and switch B in orange. (D) Domains I to IV of the protective antigen (PA) are shown in blue, green, yellow, and red, respectively (PDB entry 1acc). Ca2+ ions are shown as magenta spheres.