
Figure 43.
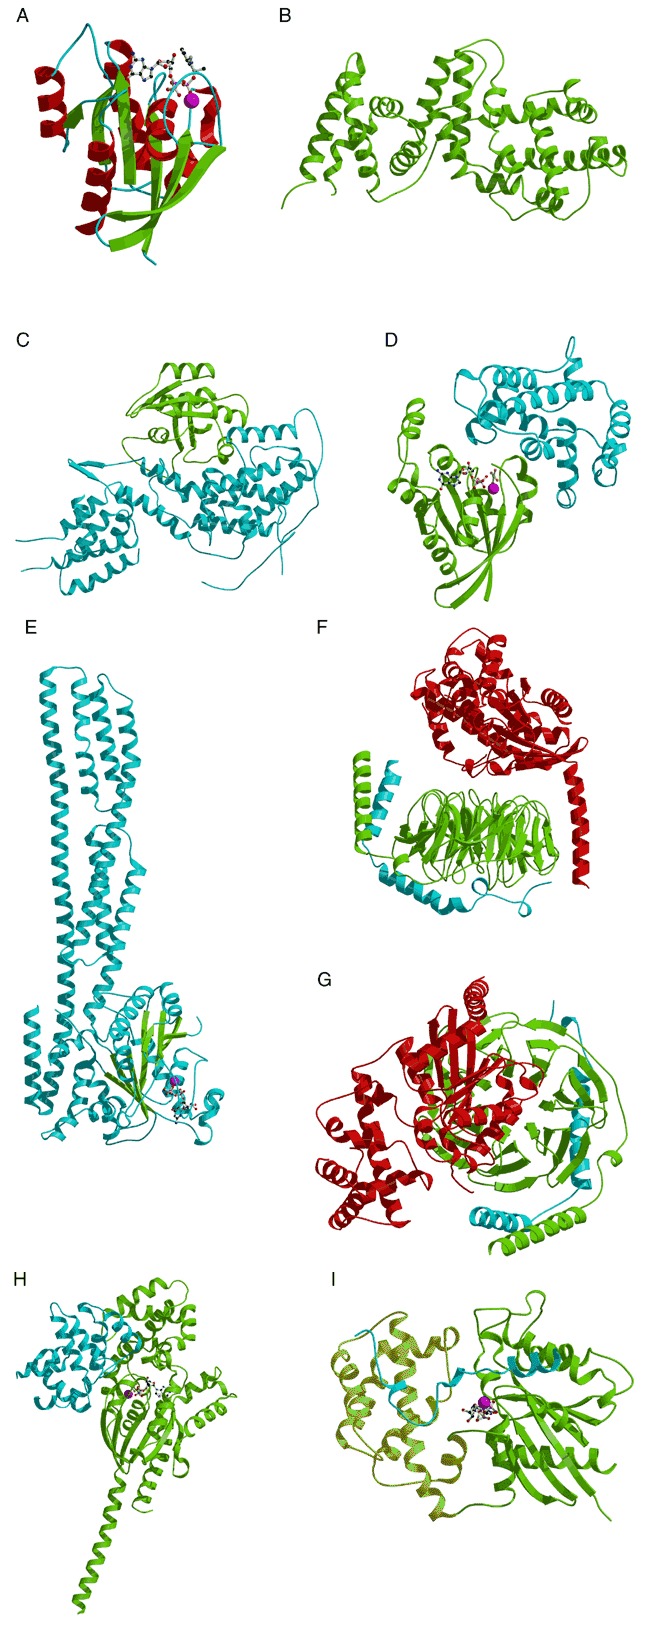
G‐protein and its regulators. The bound Mg2+ and GDP are shown as a magenta sphere and ball‐and‐stick model. (A) Structure of p21Ras (PDB entry 1gnr). A nonhydrolyzable GTP analog is shown as a ball‐and‐stick model. (B) The structure of the Ras GTPase activation domain of a human p120GAP (PDB entry 1wer). (C) The structure of Ras in complex with the Ras guanine‐nucleotide‐exchange‐factor region of Sos (PDB entry 1bkd). Ras and Sos are colored in green and blue, respectively. (D) The structure of RhoA (green) in complex with RhoGAP (blue; PDB entry 1tx4). GDP and AIF4 are shown as ball‐and‐stick models. (E) The structure of GBP1 (PDB entry 1f5n). (F) Side and (G) top view of the structure of a heterotrimeric G‐protein complex (PDB entry 1got). The Gtα‐Giα chimera is in red, Gτβ is green, and Gτγ subunit is blue. (H) The structure of RGS4 (blue) in complex with Giα‐GDP‐AlF4 − (green; PDB entry 1agr). (I) The crystal structure of a Gαi‐GDP (green and yellow) bound to the GoLoco region of RGS14 (blue; PDB entry 1kjy). GDP is shown as a ball‐and‐stick model.