
Figure 44.
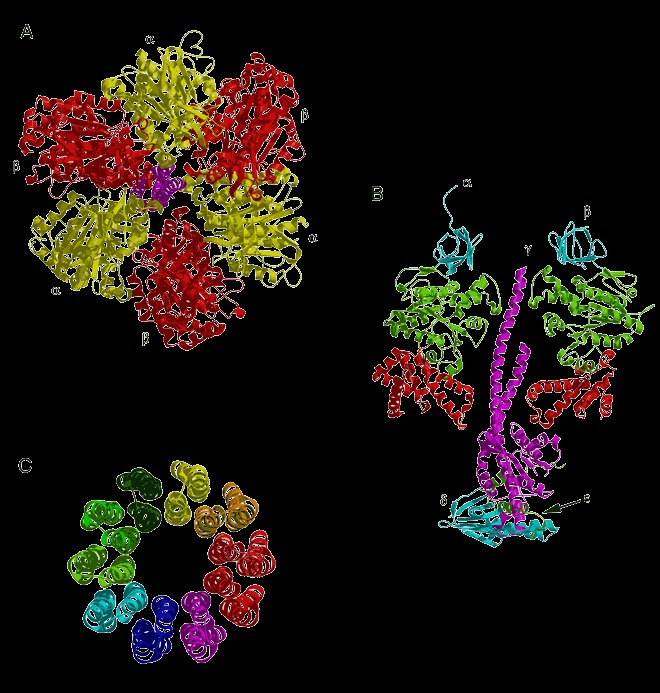
Structure of the F1ATPase. (A) Top view of bovine F1ATPase α (yellow), β (red), and γ (magenta, N‐ and C‐terminal helices only) subunits (PDB entry 1e76). (B) Side view of bovine mitochondrial F1ATPase showing one α subunit (left), one β subunit (right), and the γ (magenta, center), δ (cyan, bottom), and ε (green, bottom) subunits. The α and β subunits are each color coded by domain: N‐terminal β‐barrel is cyan, the central nucleotide‐binding domain is green, and the C‐terminal α‐helical bundle is red. (C) Cα model of ten c subunits from a yeast F0ATPase membrane domain (PDB entry 1qo1). Each subunit is a long α‐helical hairpin.