
Figure 6.
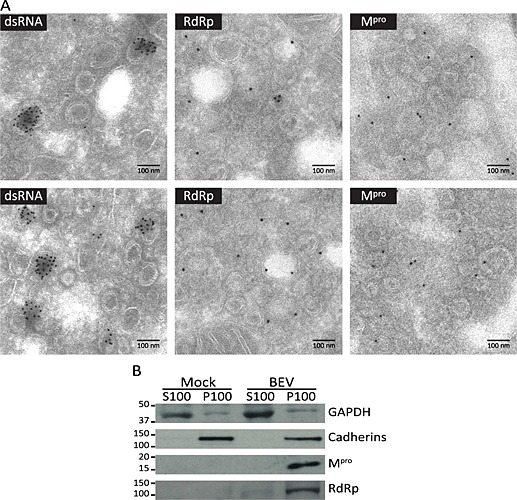
Relationship between the DMVs and the RTCs in BEV‐infected cells.
A. Cryosections of E.Derm cells infected with BEV and fixed at 16 h pi were immunogold labelled with a mAb anti‐dsRNA (left panel) or with antibodies against the RdRp (middle panel) and Mpro (right panel) and analysed by electron microscopy. Scale bars, 100 nm.
B. Immunodetection of Mpro and RdRp in a membrane‐enriched cell fraction analysed by Western blot. Mock‐infected and BEV‐infected (16 h) E.Derm cells were fractionated by differential centrifugation into cytosolic (S100) and membranous (P100) fractions and analysed by Western blot with anti‐Mpro and anti‐RdRp antibodies. As control of the fractionation procedure, antibodies against the cellular cytosolic GAPDH and membrane‐associated cadherins were also used. The positions and sizes in kilodalton of the molecular weight markers are shown at the left side of each picture.