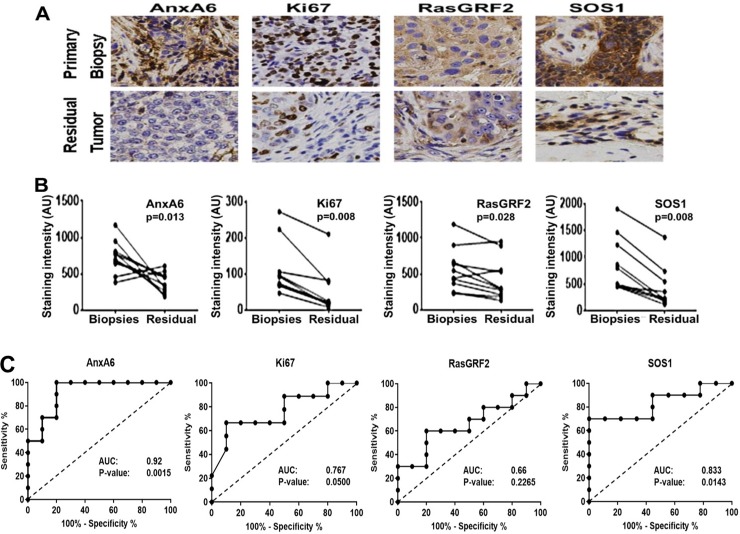
Fig 4. Expression status of AnxA6 and proliferation markers in response to cytotoxic chemotherapy.
A) Formalin-fixed paraffin-embedded TNBC tissues from primary and residual tumors following chemotherapy were stained with antibodies against the indicated proteins. Slides were processed as in Fig 2, and representative stained tumor tissues. B) The staining intensity of the indicated proteins was quantified by using the Tissues IA software. The p-values represent the mean staining intensity of the respective proteins in the primary tumors (Biopsies) compared to that in the residual tumors (Residual). C) ROC assessment of the staining intensity of AnxA6 and other proliferation markers in biopsies from patients with residual disease versus the staining intensity in the matching residual tumors. AUC: area under the curve.

