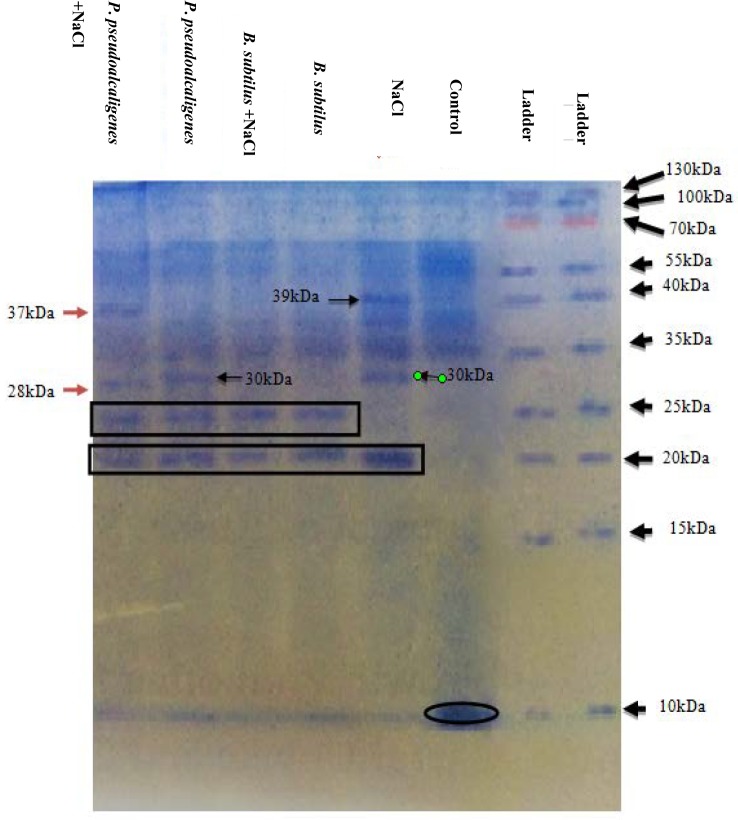
Fig 8. SDS-PAGE gel analysis of proteins extracted from soybean plants.
Protein bands were visualized using Coomassie brilliant blue staining gels from samples treated with control, 100 mM NaCl, B. subtilis, B. subtilis + 100 mM NaCl, P. pseudalcaligenes, P. pseudalcaligenes. + 100 mM NaCl, respectively. Protein bands that showed significant changes under salt stress are labelled.

