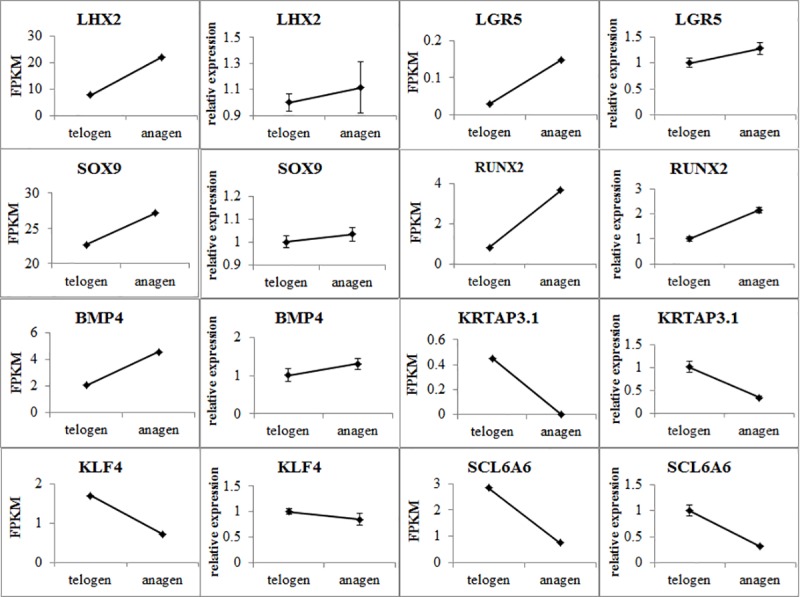
Fig 5. qRT-PCR validation of the RNA-Seq data.

The qRT-PCR data are shown as the means ± standard error (SE) of three replicates. FPKM values from the RNA-Seq analysis are shown as the means and SE of three replicates. The left side shows the qRT-PCR data, while the right side shows the FPKM values from the RNA-Seq results.
