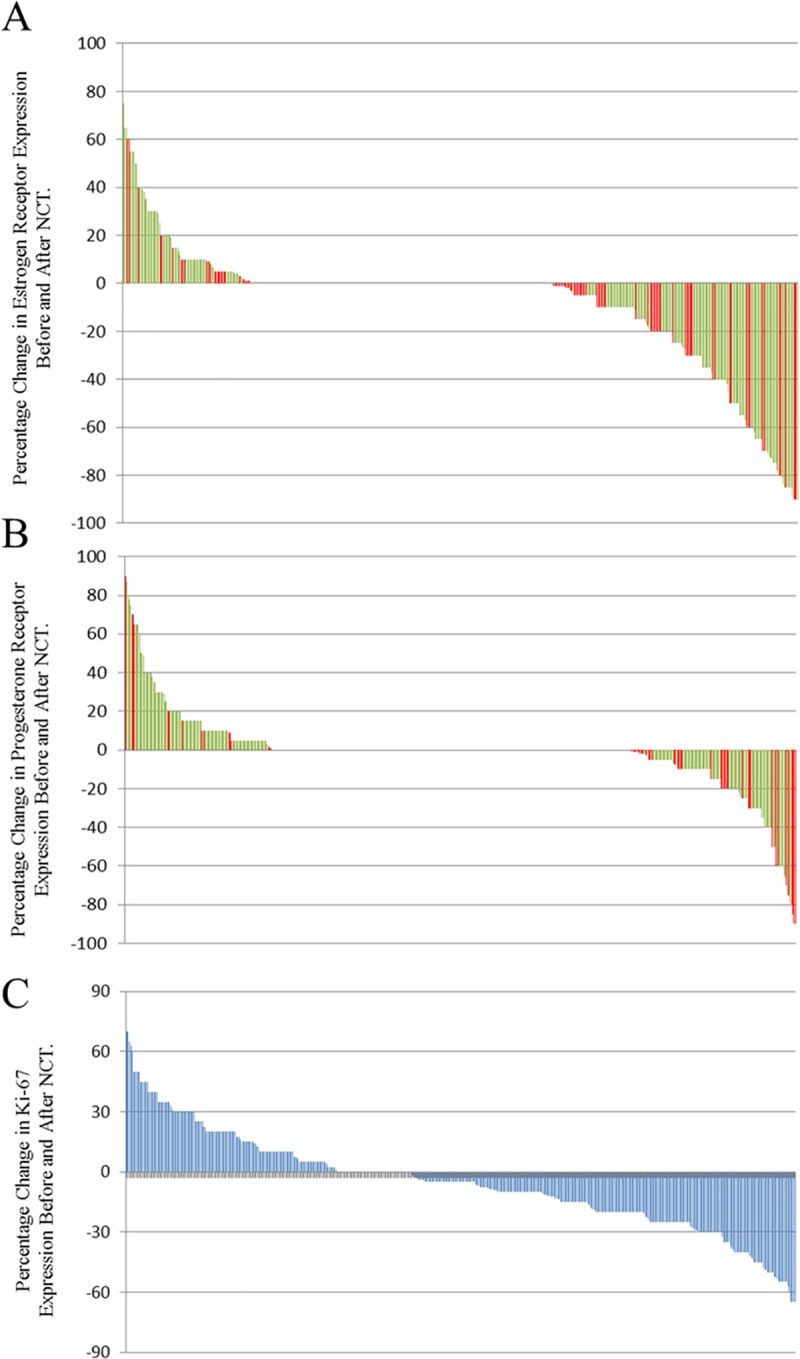
Fig 2. Waterfall plot showing the quantitative changes in ER, PR, and Ki-67 expression.

Positive scores represent an increase in receptor expression before and after NAC; negative scores represent a decrease in receptor expression. Green, concordance with the primary tumor; Red, discordance with the primary tumor. (A) ER discordance rate: 10.4% (50/482) of patients, including 36 (7.5%) patients with positive-to-negative conversion and 14 (2.9%) patients with negative-to-positive conversion; (B) PR discordance rate: 17.0% (82/482) of patients, including 57 (11.8%) patients with positive-to-negative conversion and 25 (5.2%) patients with negative-to-positive conversion; (C) Ki-67 discordance rates: 50.4% (243/448) of patients had decreased expression and 27.0% (130/448) of patients had increased expression.
