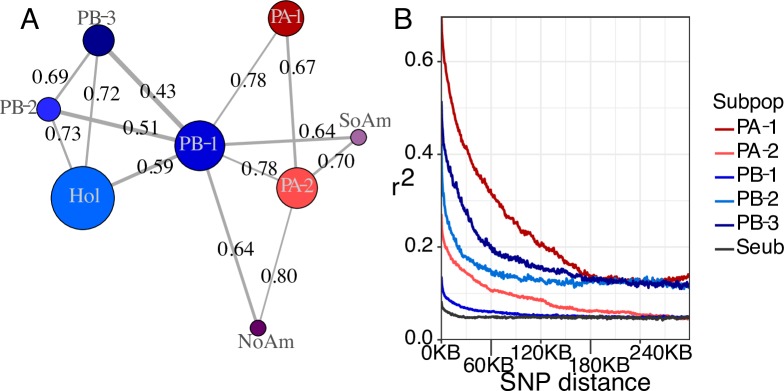
Fig 2. Population genomic parameters.
(A) Network built with pairwise FST values < 0.8 between each subpopulation. FST values are printed and correspond to line thickness, where lower values are thicker. Circle sizes correspond to genetic diversity. (B) LD decay for each subpopulation (colors) and the species in whole (black).

