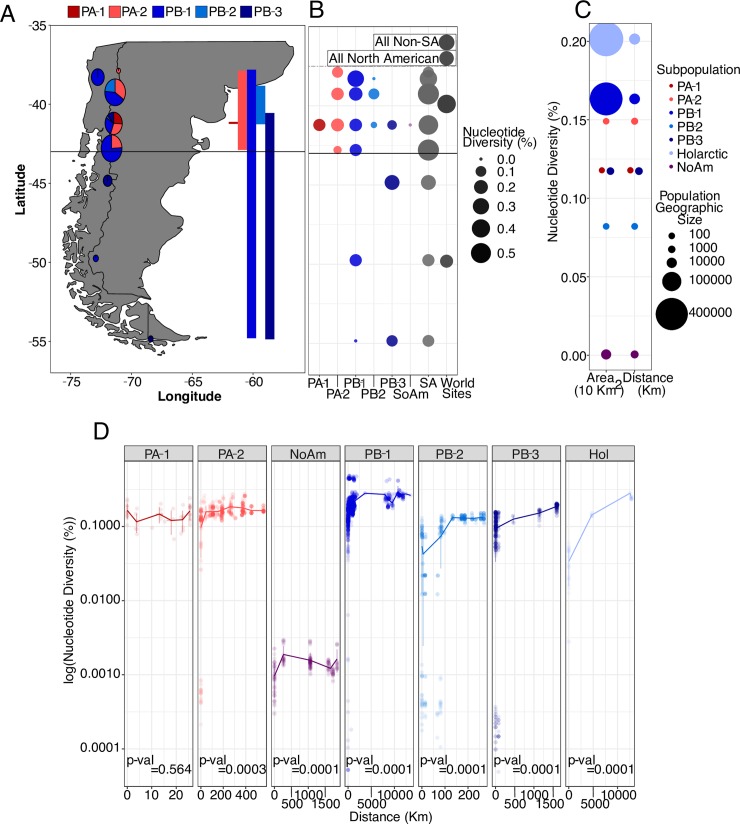
Fig 4. South American genomic diversity versus range, diversity by area, and isolation by distance.
(A) Range and genomic diversity of South American sampling sites. Circle sizes correspond to nucleotide diversity of all strains from that site, and pie proportions correspond to each subpopulation’s contribution to 𝜋 at each site. Latitudinal range of each subpopulation is shown to the right. (B) Nucleotide diversity by subpopulation by sampling site, where larger and darker circles indicate more diversity. “SA Sites” in gray show the diversity of all strains found in each South American (SA) site. “World Sites” in darker gray show the nucleotide diversity of all North American or non-South American strains, regardless of subpopulation, compared to South American strains south or north of 43°S, aligned to mean latitude of all strains included in the analysis. (C) Correlation of nucleotide diversity and the area or distance a subpopulation covers. The y-axis shows the nucleotide diversity of each subpopulation, and circle sizes correspond to the geographic sizes of the subpopulations on a log10 scale. Note that PA-1 (dark red) is as diverse as PB-3 (dark blue) but encompasses a smaller area. (D) log10(pairwise nucleotide diversity) correlated with distance between strains, which demonstrates isolation by distance. Note that y-axes are all scaled the same but not the x-axes. Holarctic includes the S. eubayanus sub-genome of two lager-brewing strains. S11A Fig shows the individual plots for the NoAm lineage. S11B Fig shows the individual plot of PB-1.

