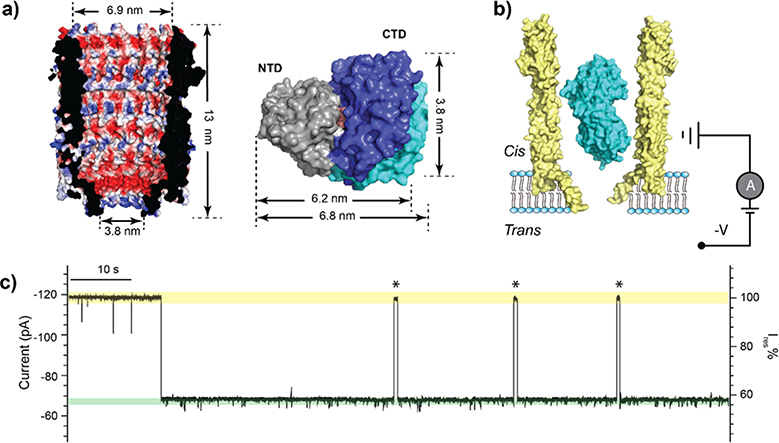
Figure 1.
Trapping of MBP within the ClyA nanopore. (a) A cross-section view of the structure of the ClyA nanopore (PDB:2WCD) showing the electrostatic potential of its inner surface (left). Surface representation of MBP structures in the ligand-free (PDB:1JW4) and bound (PDB:1ANF) states (right). The two structures are aligned by the N-terminal domain (NTD, grey), with the C-terminal domains (CTD) shown in cyan and blue for the apo and holo states, respectively. The bound maltose is shown in orange. (b) Schematic representation of an MBP trapped in ClyA with negative potential applied on the trans side. (c) Representative current trace of ClyA in the presence of MBP. The open pore current is highlighted in green, while the blockades caused by MBP in yellow. Asterisks represent MBP escape events from the nanopore. Ires% represents the ratio of residual current to open pore current. The current traces were collected at −80 mV in the buffer 150 mM NaCl, 15 mM Tris-HCl, pH 7.5 in the presence of 56 nM MBP.

