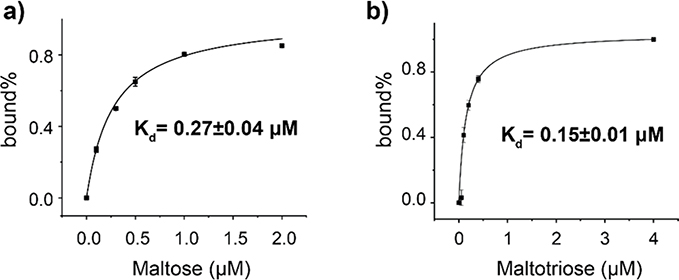
Figure 5.
Determination of the binding affinities of MBP for maltose (a) and maltotriose (b). The MBP trapping experiments were performed in the presence of increasing concentration of maltose or maltotriose. All-point histograms of the traces, such as figure 2, were used to derive the percentage of the bound states calculates as the sum of state 1, 2 and 3 divided by the state 0. The dissociation constant (Kd) was derived by fitting the data with the single-ligand binding equation.

