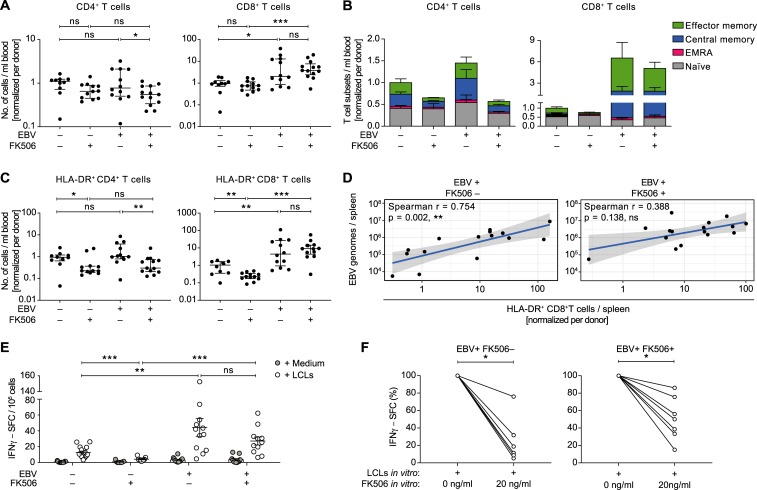
Fig 2. The EBV-induced T cell response is attenuated upon FK506 treatment.
A) Total peripheral blood CD4+ or CD8+ T cell counts at the end of the experiment from individual mice (n = 10–13 animals per group) are shown relative to the mean of the EBV−FK506– group of each HPC donor. Median (IQR), t test and MWT, respectively. B) Differentiation status of T cells in the blood at the day of sacrifice is represented as stacked bar graphs (n = 7–10 animals per group). Naïve: CD62L+ CD45RA+, central memory: CD62L+ CD45RA−, effector memory: CD62L− CD45RA−, effector memory RA+ (EMRA): CD62L− CD45RA+. C) Relative numbers of activated CD4+ or CD8+ T cells in peripheral blood were determined by HLA-DR+ surface staining and are depicted for individual mice (n = 10–14 animals per group). Median (IQR), MWT. D) Correlations between the splenic EBV DNA load and the relative number of splenic HLA-DR+ CD8+ T cells are depicted for FK506-treated and non-treated EBV-infected mice. r, spearman correlation. Solid lines represent trend lines obtained by linear regression and shaded areas indicate 95% CI of each trend line. E) Number of EBV-reactive T cells was assessed for individual mice by Elispot assays whereby IFNγ spot-forming cells (SFC) were counted upon co-culture of CD19 MACS-depleted splenocytes or bone-marrow cells with autologous LCLs or medium. Mean ± SEM, MWT. F) Reduction in IFNγ–SFC (%) upon in vitro supplementation of 20ng/ml FK506 to CD19 MACS-depleted splenocytes during the co-culture with autologous LCLs. Depicted for EBV-infected mice with (n = 7) and without (n = 6) in vivo FK506-treatment. Wilcoxon matched-pairs test on raw IFNγ–SFC counts. Composite data from two (B), three (A, C) or four (D, E) independent experiments. See also S2 Fig. *: p<0.05, **: p<0.01, ***: p<0.001.

