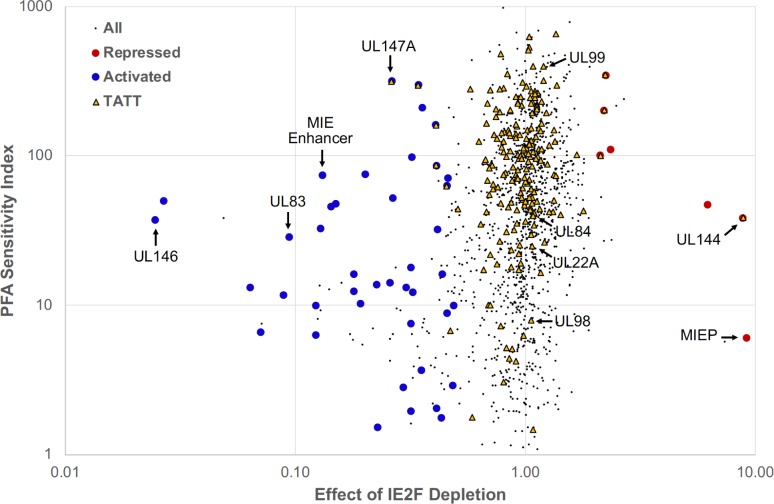
Fig 5. PSI score versus effect of IE2F depletion on TSR strength.
Each TSR is indicated by a small black dot. Repressed and activated TSRs increase and decrease in strength, respectively, when IE2F is depleted. Repressed TSRs containing a dTag / CTRL ratio greater than 2 are red. Activated TSRs with ratios less than 0.5 are blue. TSRs with an upstream TATT sequence are shown as yellow triangles. TSRs immediately downstream (within ~200 bp) from major TSRs that are due to 5ʹ ends generated by hydrolysis and not actual transcription initiation were removed from the repressed and activated lists. Such TSRs still appear in the plot as black dots but are not identified as activated or repressed. Arrows point to TSRs for the indicated viral promoters.

