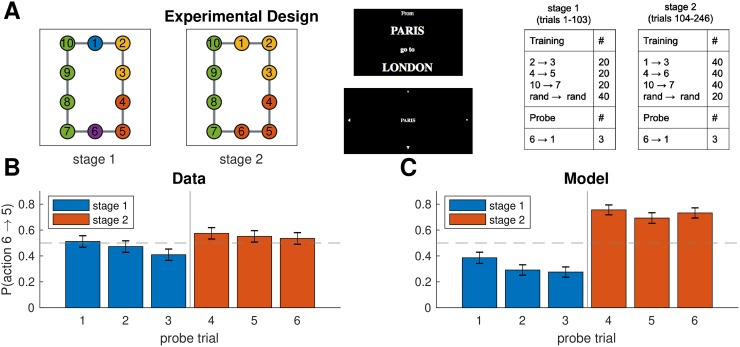
Fig 11. Learning dynamics.
A. Experiment three used the same graph as experiment one, with main difference that training (right panel) took part in two stages that promoted different hierarchies (first and second panel), with probe trials interspersed throughout training. Notation as in Fig 9A. B. Results from experiment three showing that (1) the first stage of training makes participants more likely to go to state 7 on the probe trials, which could not be explained by a “flat” associative account, (2) this tendency appears gradually as participants accumulate more evidence, and (3) this preference is reversed during the second stage of training. Error bars are s.e.m. (127 participants). C. Results from simulations showing that our model exhibited the same learning dynamics. Notation as in B.

