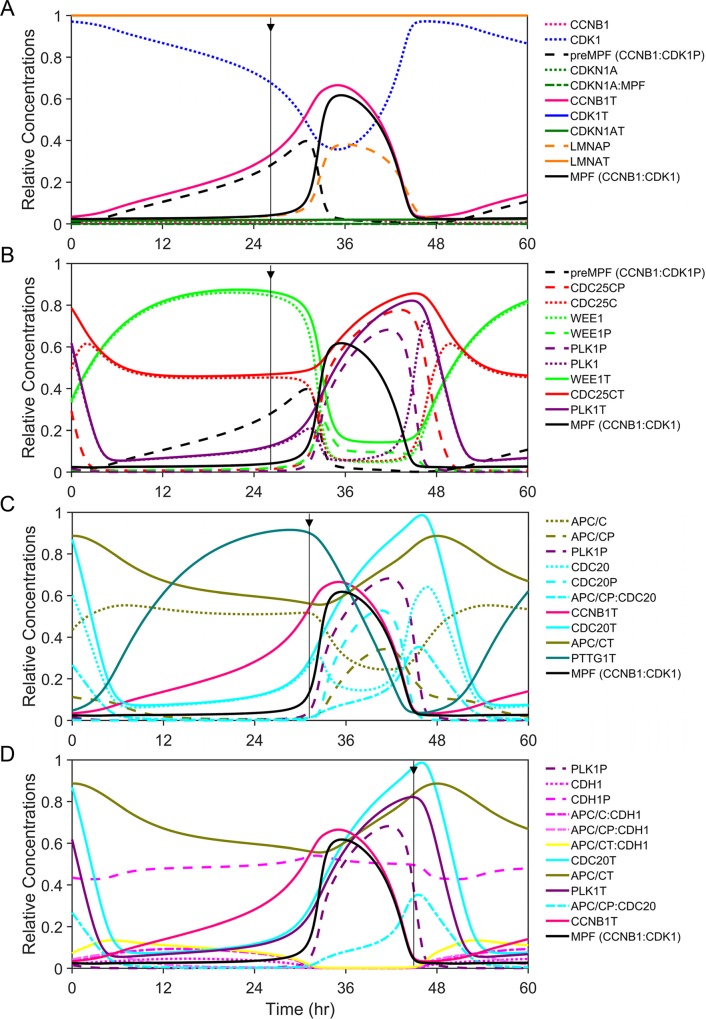
Fig 2. Subsets of regulatory relationships and functional outcomes driving the mitotic cell cycle.
Simulations of relative concentrations for key mitotic proteins and protein complexes during one cycle of mitosis over a 48 hr time scale, centered on activation/inactivation of MPF kinase (CCNB1:CDK1, black line). Each factor is identified by a unique color for line and bar graphs throughout the article. Oscillations of factors are shown relative to each and include total protein or protein complexes (T, solid lines), phosphorylated proteins (P, wide dashed lines), free unphosphorylated proteins (narrow dashed lines), and regulated interactions (mixed dashed lines). Additional phases of the cell cycle are not considered in this new model. Biochemical reactions, ODEs, and optimized model parameter values are presented in the Supporting Information. (A) Simulating increasing levels of CCNB1T (magenta) in the presence of constant CDK1T (blue) results in formation of preMPF (CCNB1:CDK1P, black) then active MPF kinase (CCNB1:CDK1, black). The vertical arrow approximates the onset of active MPF kinase (black). Subsequent changes include reduced free CDK1 (blue) and increased LMNA phosphorylation (LMNAP, orange). These occur in the absence of CDKN1AT (p21CIP1, dark green) expression. Concentrations of LMNAT (orange) and CDK1T (not visible) are constant and equal to 1. (B) Simulating increasing PLK1T (purple) and active PLK1P kinase (purple) results in active CDC25CP phosphatase (red) and inactivation WEE1P kinase (green) with its subsequent degradation and accompanying activation of MPF. The vertical arrow again approximates the onset of active MPF kinase (black). (C) Simulating the transition to metaphase by PLK1P- (purple) and MPF-mediated phosphorylation of APC/C (APC/CP, olive green) and CDC20 (CDC20P, light blue) followed by rapid dephosphorylation of CDC20P (light blue) and activation of the APC/CP:CDC20 (light blue) ubiquitin ligase complex. The vertical arrow approximates the onset of active APC/CP:CDC20 (light blue). Activation results in degradations of PTTG1T (cyan) and CCNB1T (magenta). (D) Simulating mitotic exit upon dephosphorylation of CDH1P (pink), formation and activation of APC/CT:CDH1 (APC/C:CDH1 and APC/CP:CDH1, yellow) ubiquitin ligase. The vertical arrow approximates the onset of active APC/CT:CDH1 (yellow), resulting in degradations of PLK1T (purple), CDC20T (light blue) and any remaining CCNB1T (magenta).

