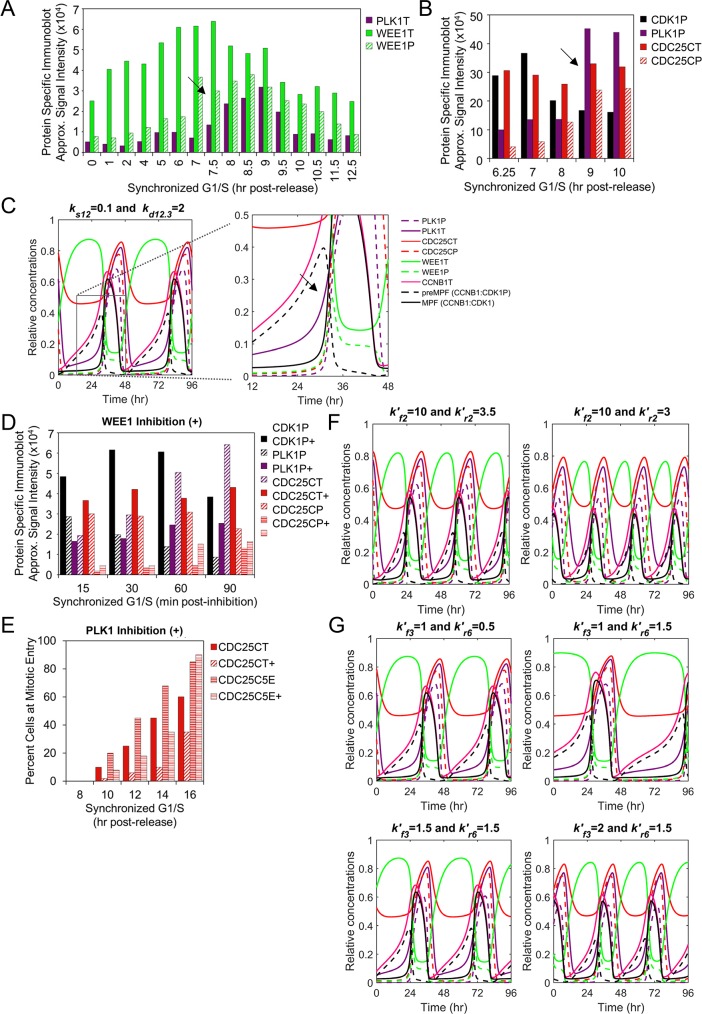
Fig 5. Role of PLK1 in stimulating mitotic entry and MPF kinase activation.
(A) Approximated steady-state protein levels from studies by Watanabe et al. [38] using immunoblot analysis of PLK1T, WEE1T and WEE1P in HeLa cells following release from synchronization in the G1/S phase with mitosis observed between 9–10 hr. Arrows mark points of comparison between in vitro and in silico data. (P, phosphorylated protein; T, total protein) (B) Approximated steady-state protein levels of CDK1P (i.e. preMPF), PLK1P, CDC25CT and CDC25CP following release of HeLa cells from G1/S from studies by Gheghiani et al. [7]. (C) Simulation of PLK1 expression with oscillations in PLK1P, PLK1T, CDC25CT, CDC25CP, WEE1T, WEE1P, CCNBT, preMPF (CCNB1:CDK1P) and active MPF kinase (CCNB1:CDK1). Boxed area is magnified. (D) Approximated steady-state protein levels from experiments by Gheghiani et al. [7] described in (B) upon inhibition (+) of WEE1 kinase activity relative to control. (E) Percent of cells at mitotic entry as determined by Gheghiani et al. [7] using HEK293 cells expressing a wild-type CDC25C reporter or a phosphomimic CDC25C5E and following inhibition (+) of PLK1 compared to control. (F) Simulated inhibition of WEE1 () and associated changes in factors as described in (C). (G) Simulated inhibition of PLK1 () for wild-type CDC25C or phosphomimic CDC25C5E and associated changes as described in (C). Phosphomimic CDC25C5E is introduced by reducing PPase activity at resulting in increased CDC25CP.

