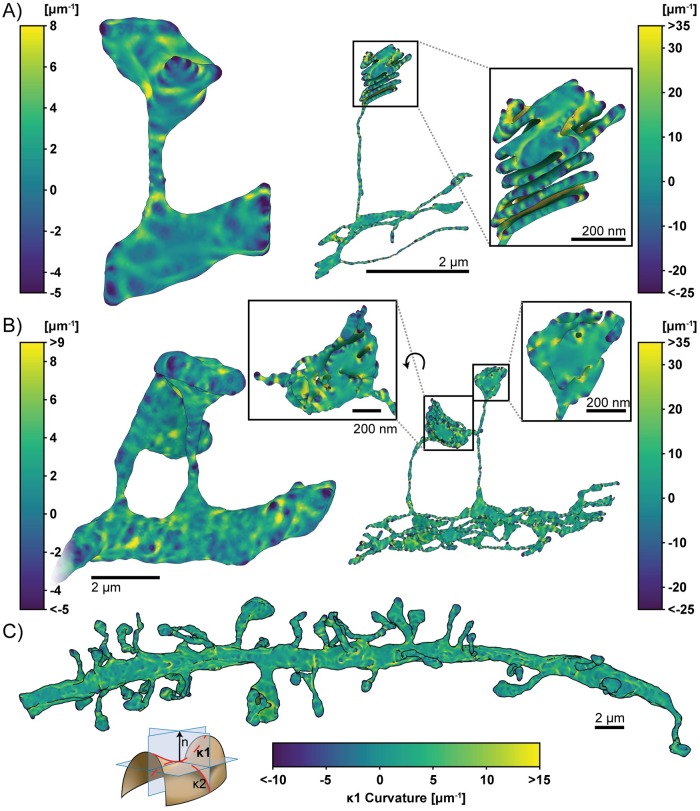
Fig 8. Estimated first principal curvatures of the spine geometries.
The signed first principal curvature, corresponding to the maximum curvature at each mesh point, is estimated using GAMer 2. Color bars correspond to curvature values with units of μm-1. We have adopted the sign convention where negative curvature values refer to convex regions. Geometries are A) single spine model, left: plasma membrane, right: endoplasmic reticulum; B) two spine model, left: plasma membrane, right: endoplasmic reticulum; and C) plasma membrane of the dendritic branch model. Scale bars: full geometries 2 μm, inlays: 200 nm. Curvature schematic modified from Wikipedia, credited to Eric Gaba (CC BY-SA 3.0).

