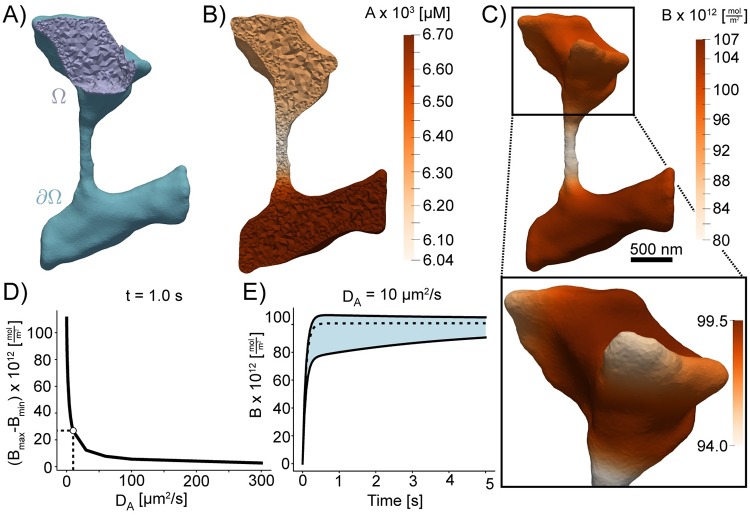
Fig 10. Simulations of coupled surface volume diffusion.
A) Illustration of the domains for the volume and surface PDEs. B) and C) The concentrations of species A and B, respectively, at t = 1.0s when DA is set to 10 μm2/s. D) Difference between maximum and minimum values of B at t = 1.0s; the point DA = 10 μm2/s corresponding to panels B) and C) is marked. E) the minimum, mean, and maximum of B over time when DA = 10 μm2/s; a vertical bar is drawn at t = 1.0s. Scale bar: 500nm.

