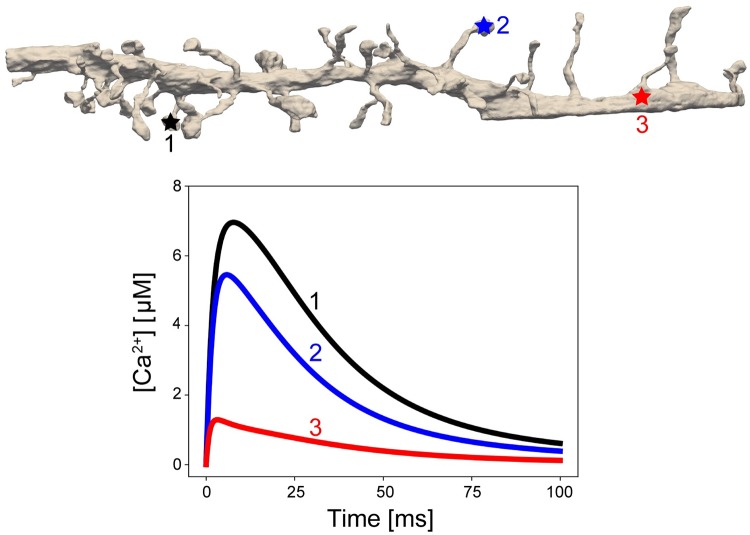
Fig 13. Representative traces of Ca2+ concentration over time at three positions.
Spine and PSD morphology affect the calcium ion dynamics. For traces 1 and 2, variations in the PSD area and spine head volume lead to different peak calcium ion concentrations. At point 3, the calcium ion concentration values are diminished due to both calcium buffering in the cytosol and the spine neck behaving as a diffusion barrier.

