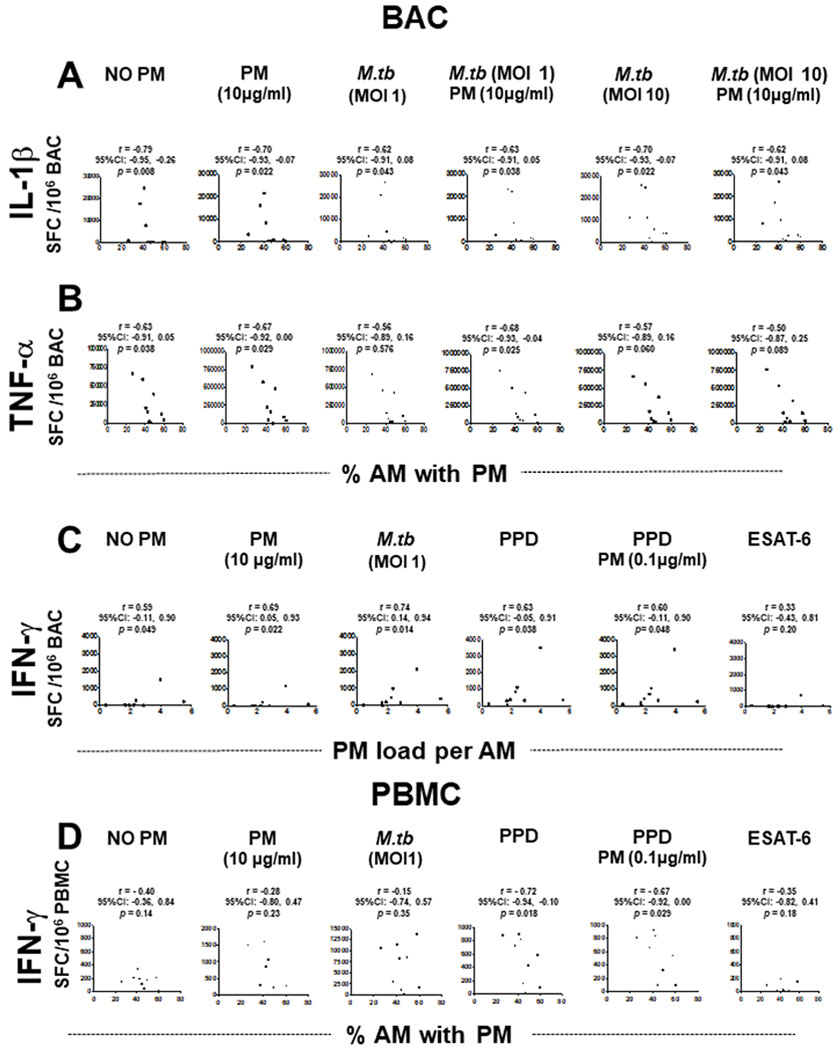
Figure 5.

Correlations between in vivo-acquired PM burden in AM (%AM with PM or PM load per AM) and frequencies of cytokine-producing BAC and PBMC. Frequencies of IL-1β (A), TNF-α (B) and IFN-γ (C) spot-forming cells (SFC) in BAC (n=9) and frequencies of IFN-γ-SFC in PBMC (n=9) (D) are shown as a function of PM burden in AM following exposure to PM2.5 and/or M.tuberculosis infection, or PPD and ESAT-6 stimulation. Data points represent participants and slopes’ positive or negative correlations. Spearman’s r correlation coefficient test was performed using the GraphPad Prism software for Mac OS X V.6.0. A CI for all statistics test of 95% (α=0.05) was used. The p values, r values and CIs are indicated in all the experimental conditions. AM, alveolar macrophages; BAC, bronchoalveolar cells; IFN, interferon; IL, interleukin; M.tuberculosis, Mycobacterium tuberculosis; PBMC, peripheral blood mononuclear cells; PM, particulate matter; PPD, purified protein derivative; TNF, tumour necrosis factor; ESAT-6, 6kDa secretory antigenic target.
