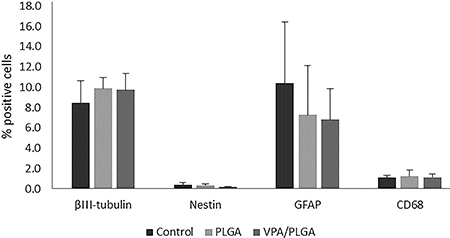
Figure 7. Analysis of expression of βIII-tubulin, Nestin, GFAP, and CD68 by flow cytometry for the control, poly(lactic-co-glycolic acid) (PLGA), and valproic acid (VPA)/PLGA groups. Results are reported as percentage of positive cells (n=4/group). Data are reported as means±SD.

