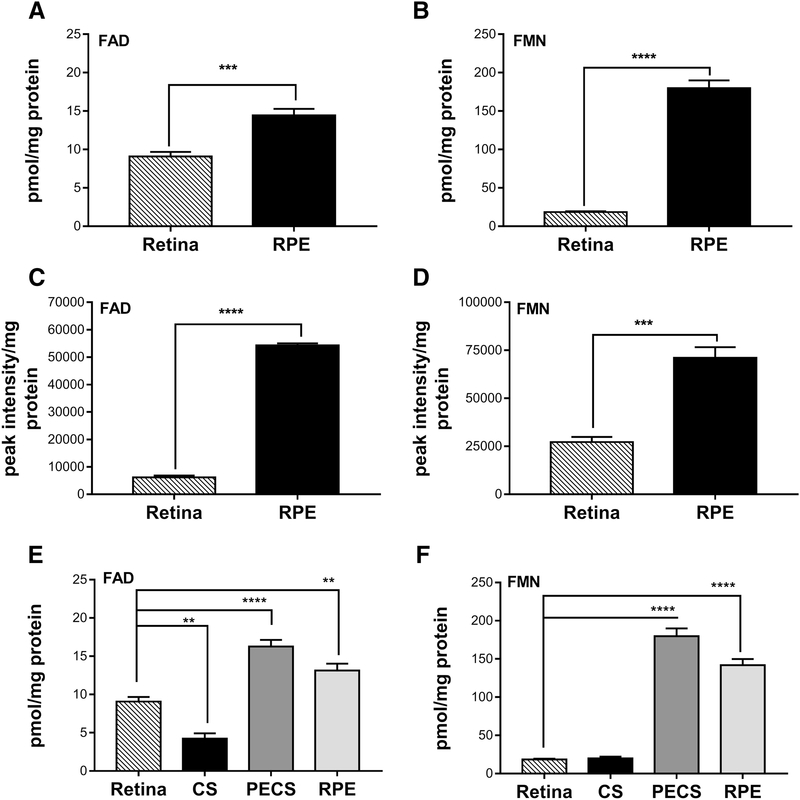
Figure 4.
Basal physiological levels of flavins in the mouse retina and RPE. (A&B) FAD and FMN levels from retinas and RPE of P45 mice assessed by HPLC (*** for FAD p<0.0007 and **** for FMN p<0.0001). (C&D) FAD and FMN from retinas and RPE of P42 mice quantified by LC-MS (**** for FAD p<0.0001 and *** for FMN p<0.0004). (E&F) FAD and FMN levels from retinas, choroid and sclera complex (CS), PECS complex and RPE by HPLC. Unpaired t-test was used to assess significance for A-D and one way ANOVA for E&F. Values obtained from HPLC are presented as pmol/mg protein and those obtained from LC-MS are expressed as peak intensity per mg protein (n=12 for each of the retina and RPE measured by HPLC,n=4 for each of the retina and RPE measured by LC-MS and n=4 for each of retina, CS and PECS measured by HPLC).

